Chapter I. Pathogenesis
| Rev Diabet Stud,
2012,
9(4):201-223 |
DOI 10.1900/RDS.2012.9.201 |
From Markers to Molecular Mechanisms: Type 1 Diabetes in the Post-GWAS Era
Alan G. Baxter, Margaret A. Jordan
Comparative Genomics Centre, Molecular Sciences Building 21, James Cook University, Townsville QLD 4811, Australia
Address correspondence to: Alan G. Baxter, e-mail alan.baxter@jcu.edu.au
Manuscript submitted December 16, 2012; resubmitted February 2, 2013; accepted February 8, 2013.
Keywords: type 1 diabetes, genome-wide association study, GWAS, HLA, Lyp, IDDM, linkage analysis, polymorphism, haplotype
Abstract
By the year 2000, a draft of the human genome sequence was completed. Millions of single-nucleotide polymorphisms (SNPs) had been deposited into public databases, and high throughput technologies were under development for SNP genotyping. At that time, it was predicted that large case control association studies would provide far better resolution and power than genome-wide linkage studies. Type 1 diabetes was one of the first phenotypes to be examined by genome-wide association studies (GWAS), and to date over 50 genomic regions have been associated with the disease. In general, the great majority of these loci individually contribute a relatively small degree of risk, and most loci lie outside of coding sequences. The identification of molecular mechanisms from these genomic data therefore remains a significant challenge. Here, we summarize genetic candidate, linkage, and association studies of type 1 diabetes and discuss a potential strategy to identify mechanisms of disease from genomic data.
Abbreviations: CIITA – MHC class II transactivator ; CLEC16A – C-type lectin domain family 16; CNV – copy number variation; CSK – C-terminal Src kinase; CTLA4 – cytotoxic T lymphocyte antigen 4; CUE - coupling of ubiquitin conjugation to ER degradation; DZ – dizygotic; eQTL – expression quantitative trait loci; ERBB3 – v-erb-b2 erythroblastic leukemia viral oncogene homologue 3 (avian); ESR – estrogen receptor; FAP – fibroblast activation protein; FGFR3 – fibroblast growth factor receptor 3; GAD - glutamate decarboxylase; GCA – grancalcin; GWAS – genome-wide association study; HapMap – Haplotype Map (project); HLA – human leukocyte antigen; HOXD8 – homebox D8 gene; HTS – high throughput sequencing; IDDM – insulin-dependent diabetes mellitus; IFIH1 – interferon induced with helicase C domain 1 ; IL – interleukin; INSR – insulin receptor; KCNH7 – potassium voltage-gated channel and subfamily H member 7; LCK – lymphocyte-specific protein tyrosine kinase; LD - linkage disequilibrium; LOD – logarithm of the odds; LRP5 – low-density lipoprotein receptor-related protein 5; LYP – lymphocyte tyrosine phosphatase; MHC – major histocompatibility complex; MZ – monozygotic; NAA25 – N(alpha)-acetyltransferase 25; NF-κB – nuclear factor 'kappa-light-chain-enhancer' of activated B-cells; NK – natural killer; Ns – non-synonymous; ORF – open reading frames; PBMC – peripheral blood mononuclear cell; PTP – protein tyrosine phosphatase; PTPN22 – protein tyrosine phosphatase, non-receptor type 22; PVR – poliovirus receptor; SNP – single nucleotide polymorphism; SOCS1 – suppressor of cytokine signaling 1; SUMO4 – small ubiquitin-related modifier 4; T1D – type 1 diabetes; T1DGC – Type 1 Diabetes Genetics Consortium; Treg – regulatory T; TCR – T cell receptor; TDT – transmission/disequilibrium test; TLR – toll-like receptor; VNTR – variable number tandem repeat; WTCCC – Wellcome Trust Case Control Consortium; ZAP70 – zeta-chain-associated protein kinase 70
1. Clinical definition of type 1 diabetes
Type 1 diabetes (T1D) is characterized by failed glucose homeostasis and hypoinsulinemia caused by autoimmune destruction of the insulin-producing β-cells in the pancreas. Signs include osmotic diuresis and loss of weight, and symptoms include polyuria, polydipsia, polyphagia, and tiredness; potentially fatal complications include ketoacidosis and hyperglycemic coma. The disease is a complex genetic trait, in which multiple genetic, environmental, and stochastic factors contribute to risk. Progression from the preclinical stage of β-cell autoimmunity (insulitis) to established diabetes can take up to a decade [1-2].
2. Familial risk of type 1 diabetes
Evidence for a genetic contribution to the risk of T1D includes increased prevalence of disease in first-degree relatives (2.5-6.0% versus 0.1-0.3% in the general population of Western countries) with a λs of about 15 [3-4]. T1D has a high concordance in monozygotic (MZ) twins and intermediate concordance in dizygotic (DZ) twins (27% and 3.8% respectively) [5]. This is associated with a lifetime risk for the twin of an affected proband of 44% and 19% respectively [6]. The prevalence of T1D varies markedly between countries and is increasing at a rate of about 3% per year [7], a change that is associated with alterations in autoantibody profiles and accelerated onset of disease from the time of identification of autoantibodies. These trends are consistent with changing environmental effects on the pathogenesis of the disease [8-9].
3. Association of HLA with T1D
The major histocompatibility complex (MHC) was originally identified in murine allogeneic tumor transplantation experiments [10-11]. Gorer, Lyman, and Snell (1948) demonstrated that various mouse backcross strains varied in their resistance to the growth of allogeneic tumors, and that this trait segregated with a tail deformity (termed "fused"), indicating that the genes were linked. Identification of the analogous gene complex in humans (termed the human leukocyte antigen (HLA) complex) was made when three groups described antibodies in sera from multi-transfused patients or multiparous women that aggregated the leukocytes of many, but not all, donors [12-14].
The HLA shows association with T1D (locus termed IDDM1; Table 1) [15-22] and accounts for approximately 40% of the familial aggregation of the disease. The predisposing HLA class II haplotypes, HLA-DRB1*04, DQB1*03:02 (identified by serology as DR4) and DRB1*03:01, DQB1*02:01 (DR3) are present in 95% of affected individuals. DR3/DR4 heterozygotes carry an absolute risk of T1D of approximately 5% (compared to a cumulative incidence of ~0.3% in Western communities), which rises to about 20% if a haploidentical sibling is affected [19, 23]. DQ amino acid sequences directly correlate to risk of T1D. This association is largely dependent on the identity of residue 57 of the DQβ chain (Asp is protective and Ala confers susceptibility) [24] and 52 of the DQα chain (Arg confers susceptibility) [25]. Khalil et al. (1990) reported that of 50 T1D patients, all expressed the DQα-52Arg/DQβ-57Ala susceptible heterodimer [25]. Remarkably, the NOD mouse model of T1D expresses an Aβ chain homologous to DQβ with a substitution at position 57 [24]. The hypothesis arising from these observations is that disease-associated HLA class II alleles permit binding of disease-inducing peptides. In this regard, the molecular mimicry hypothesis specifically proposes that bi-reactive T cell receptors (TCR) permit the priming of T cells by a microbial peptide and effector activation by autoantigens, both presented within the context of specific MHC antigens.
Table
1.
A selection of T1D genes |
|
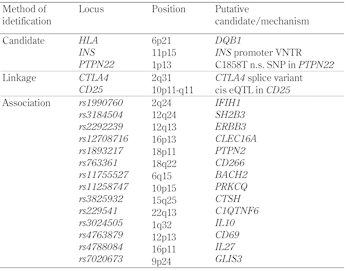 |
 |
Atkinson et al. (1994) reported a possible example of molecular mimicry in T1D [26]. Stimulation of peripheral blood mononuclear cells (PBMCs) from people at increased risk of T1D with an overlapping panel of synthetic peptides from the T1D-associated autoantigen glutamate decarboxylase (GAD) [27] identified a major determinant (amino acids 247-279) that had significant sequence similarity to the P2-C protein of Coxsackie B virus, which had been previously associated with the onset of T1D [28]. Furthermore, PBMC from individuals responding to GAD peptides also responded to a Coxsackie P2-C peptide (amino acids 32-47). Rudy et al. (1995) [29] subsequently identified a 13 amino acid peptide of another T1D-associated autoantigen, proinsulin (amino acids 24-36) [30], which bears marked similarity to a peptide of GAD65 (amino acids 506-518). Reactivity to both proinsulin and GAD peptides was significantly greater among at-risk subjects than controls. Many other putative examples of molecular mimicry in T1D have been described (reviewed in [31]).
4. Association of other candidate genes with type 1 diabetes
Other T1D candidate genes, such as putative autoantigens and immune receptors, were examined for association with T1D because of their biological relevance to disease.
4.1 INS
Insulin is primarily transcribed in the beta-cells of pancreatic islets and is a major autoantigen in T1D [32]. There are three common polymorphisms in strong linkage disequilibrium (LD) within the insulin (INS) gene on 11p15:
1. A variable number tandem repeat (VNTR)
2. -23HphI in the promoter
3. +1140A/C
The VNTR is the best candidate because it contains binding sites for many transcription factors, including Pur1 [33], while there is no obvious functional role for either of the two single-nucleotide polymorphisms (SNPs) [34]. The shortest alleles of the VNTR locus (class I alleles; 26-63 repeats) are associated with T1D in HLA-DR4-expressing subjects (OR 1.9; IDDM2) [35-38]. Class III alleles (the longest; 141-209 repeats) of the VNTR are associated with marginally lower levels of insulin mRNA expression in pancreata [38], but a 2-3-fold higher expression in fetal thymus [39]. These data are consistent with the hypothesis that protective alleles of the INS VNTR are responsible for increased thymic insulin expression, driving a more effective induction of central tolerance of insulin-reactive T cells.
4.2 PTPN22
PTPN22, on chromosome 1p13, encodes the lymphocyte-specific protein tyrosine phosphatase LYP, which is a negative regulator of TCR signaling, via the dephosphorylation of several TCR proximal signaling molecules, including the SRC family kinases LCK and FYN, ZAP70, and TCRζ. A nonsynonymous SNP at position 1858 of PTPN22 was reported to be associated with T1D in many populations (OR for the heterozygous C/T genotype was 1.7) [40-45]. This C1858T SNP resulted in a missense mutation in people bearing the T1D risk allele that changed an arginine to a tryptophan at position 620 (R620W), resulting in the inability of LYP to bind its signaling molecule CSK [46], which increases phosphatase activity. T cells carrying the LYP-W620 variant show reduced production of interleukin (IL)-2 and other cytokines following TCR stimulation [46-47].
TCR and immunoglobulin loci were also examined as candidates, but without consistent evidence of involvement.
5. Linkage studies of type 1 diabetes
The availability of dense maps of polymorphic genetic markers (microsatellites and SNPs) revolutionized the localization of non-HLA-linked disease genes [48-51]. Linkage analyses rely on disproportionate transmission of alleles to affected and unaffected progeny. The first genome-wide scans for linkage to T1D were performed on large collections of T1D families with pairs of affected siblings (sib-pairs) by microsatellite (variable number of tandem repeat) analysis in 1994 [52-53] (http://www.t1dbase.org). They were some of the earliest examples of genome-wide linkage mapping in humans, even though, by today's standards, they were relatively underpowered for the identification of non-HLA-linked genes.
In the early studies, an initial genome-wide scan was performed on a subset of samples, and then additional samples were analyzed at a subset of loci. Both Davies et al. (1994) [52] and Hashimoto et al. (1994) [53] confirmed linkage to the HLA, both by their own statistical thresholds, and by those of Lander and Kuglyak (1995) [54], which are set to a 5% probability per study of a single genomic region exceeding the significance threshold by chance (i.e. a logarithm of the odds (LOD) score >3.6). Davies et al. (1994) calculated that the HLA contributes about 42% of the familial clustering of T1D [52]. Neither group found evidence of linkage at INS.
5.1 FGF3/LRP5
Davies et al. (1994) identified ten other chromosomal regions that exceeded a maximized LOD score of 1.7 in their screening panel of 96 families from the United Kingdom [52]. Analysis of a total of 282 pairs (including an additional cohort from the United Kingdom and one from the USA) provided a maximal LOD score of 1.5 at a microsatellite near ESR (IDDM5) on chromosome 6q, and a maximized LOD score of 1.3 at FGF3 (IDDM4) on chromsome 11q13. Significance at FGF3 (but not ESR) was increased by excluding from analysis sib-pairs that shared (identical by descent) both HLA alleles. Under these circumstances, the US cohort (and not the combined dataset) reached Lander and Kuglyak’s threshold for suggestive linkage (i.e. a LOD score >2.2). Higher resolution mapping was performed on families for which both siblings were under the age of 17 at the time of diagnosis, providing a linkage peak with a LOD of 3.4 at FGF3. Linkage to T1D at both IDDM4 and IDDM5 were subsequently confirmed by Luo et al. (1996), with maximized LOD scores of 3.9 and 4.5 respectively [55].
Hashimoto and colleagues carried out a genome-wide scan on 314 IDDM-affected sib-pairs who were Caucasian but of French, American, and North African origin [53]. Initially, 61 affected sib-pairs from French and North American families were screened at 321 markers, followed by a screen of the rest of the subjects at loci where an uncorrected linkage significance of p < 0.05 was obtained. Other than the HLA, their most significant linkage was to FGF3 with a LOD score of 2.59. Restriction of the analysis to HLA-DR3-positive sib-pairs resulted in a LOD of 4.02, exceeding Lander and Kuglyak's threshold for significant linkage. It should be noted that, while both Davies et al. (1994) [52] and Hashimoto et al. (1994) [53] provided evidence for linkage to FGF3 based on a conditional analysis of HLA type, the HLA conditions required to obtain significance were in opposite directions. Davies et al. (1994) [52] reported increased significance when affected sib-pairs with HLA allele sharing were excluded, and Hashimoto et al. (1994) [53] reported significance when they were exclusively studied. These contradictory findings cannot both be interpreted as strengthening evidence of linkage with FGF3 [56]. Hashimoto et al. (1994) also reported a region of suggestive linkage on chromosome 8p, with a LOD score of 2.25 [53].
A third group published a T1D sib-pair linkage analysis a month later, in which 250 families were analyzed [57]. The strongest linkage was obtained at a locus near D15S107 on chromosome 15q, with a maximum LOD score of 2.54 (IDDM3). The authors found that the strongest evidence of linkage came from sib-pairs who did not extensively share HLA alleles. Furthermore, in these families, sib-pair disease concordance was strongly related to the proportion of genes the pair shared at D15S107. This locus could not be confirmed by Luo et al. (1996) using 265 families (i.e. maximized LOD was <2.2) [55], nor has it received significant support in subsequent studies.
5.2 Gene/gene interactions
Genome-wide statistical significance thresholds are established on the assumption that a single analysis would be performed, not that the samples would be reselected to test a series of post-hoc analyses. This issue reduces confidence in IDDM4 and IDDM5. Nevertheless, in these pioneering studies, it was far from clear what variables would prove relevant. These early studies gave way to formal multi-locus analyses that allowed the examination of multiple factors simultaneously, providing increased power to detect the effects of weaker loci and identifying interactions between loci [58-59]. Application of these methods indicated that the interaction between IDDM1 and IDDM2 (HLA and INS) was multiplicative (synergistic). This is consistent with the proposed mechanisms of action of the two genes, with IDDM2 affecting levels of thymic insulin transcription for presentation in the context of HLA class II molecules, in central tolerance induction. In contrast, the data for IDDM1 and IDDM4 were consistent with genetic heterogeneity, a model in which risk is caused by any of the multiple alleles and loci [59].
5.3 SUMO4
The IDDM5 locus on chromosome 6q was brought into prominence by the cloning of SUMO4, a gene in this interval encoding small ubiquitin-like modifier 4 protein. An SNP (163A->G) in SUMO4 results in the substitution of a highly conserved methionine with a valine residue (M55V) within the conserved CUE domain. SUMO4 conjugates to IκBα and negatively regulates NFκB transcriptional activity. The M55V substitution is associated with suppressed activation of heat shock transcription factors, over five times greater NFκB transcriptional activity, and a two-fold increase in IL-12B expression [60-61].
This polymorphism was found strongly associated with T1D―in opposite directions―by two different groups (noted by 62): Bohren et al. (2004) claimed that the 163A allele was positively associated with disease (p < 5 x 10⁻⁴) [60], whereas Guo et al. (2004) reported that the non-conserved 163G allele was disease-associated (p < 2 x 10⁻⁷) [61]. Furthermore, in the data reported by Guo et al. (2004), there was a subset of 92 multiplex British families featuring a positive, but not significant, association of the 163A allele with disease [61]. Subsequently, some very large studies have failed to find an association [62], while others confirmed the association between SUMO4 M55V polymorphism and T1D [63]. Smyth et al. (2005) [62] reflected that, given the large numbers of linkage studies performed in T1D, even a small p-value can provide a false positive risk, and that this risk can be compounded by selection biases in the collection of samples, genotyping errors, population substructure, and post-hoc subgroup analyses. At the time of writing, the most recent meta-analysis of SUMO4 polymorphisms in T1D concluded that the SUMO4 M55V polymorphism does confer susceptibility to T1D in Asians, with only a marginal association in Europeans [64].
5.4 CTLA4
In an analysis of affected sib-pairs lacking high-risk HLA-DR3/4 haplotypes and expressing homozygous high-risk class I VNTR alleles, an additional susceptibility gene was located on chromosome 2q31 near HOXD8 (IDDM7; maximum LOD 4.8) [65]. This region is homologous to that on proximal mouse chromosome 1 where the Idd5 T1D gene was subsequently identified in diabetes-prone NOD mice [66], and contains the disease candidate genes CTLA4 and CD28 that encode receptors on T cells involved in control of T cell activation. CTLA4 (at 2q33) was considered a strong candidate because it mediates T cell apoptosis and negatively regulates T cell activation [67].
The candidature of CTLA4 was supported by a subsequent linkage analysis in 48 Italian families, by transmission/disequilibrium test (TDT) in 187 Italian families (138 of which had only a single affected child) and 44 Spanish families, and a population-based case/control association study of 966 patients and 1058 controls from Belgium [68]. Similar studies in British, Sardinian, and American families did not find an association between this gene and T1D [68]. On the basis of CTLA4 being 10 cM distal of the IDDM7 linkage peak (D2S152), and the lack of disequilibrium between D2S152 and CTLA4 in the association study, the locus at 2q33 was designated IDDM12 [68]. In an association study of multiple ethnic groups, strong deviation for transmission of an A->G polymorphism in the first exon was seen in Italian, Spanish, French, Mexican-American, and Korean populations, while British, Sardinian, and Chinese showed none [69]. A meta-analysis of 33 independent studies showed an odds ratio of 1.45 for the G allele, with a greater effect in cases with onset <20 years (odds ratio 1.61) [70].
Ueda et al. (2003) examined expression levels of the two major isoforms of the most disease-associated SNP (CT60) [71]: the full-length sequence and a soluble isoform (s-CTLA-4) that lacks exon 3 [72]. The disease-susceptible genotype was associated with lower expression of sCTLA-4 in a gene dose-dependant manner. Similarly, sequence-dependent variation in Ctla4 isoforms were identified in T1D-susceptible NOD mice, and differential expression of one appeared to mediate the allelic variation in T1D risk that maps to this chromosomal region [72-74]. CTLA-4 is expressed constitutively on regulatory T (Treg) cells and is thought, at least in part, to mediate their immunosuppressive activities [75] as interaction of CTLA-4 with CD80 or CD86 inhibits human T cell activation [76]. Soluble CTLA-4 also has this activity [72], and a knock-down transgene for sCTLA-4 exacerbated T1D in an NOD congenic strain that expresses the wild-type Ctla4 allele [77].
5.5 CD25
The 10p11-q11 region (designated IDDM10 in unpublished data by Todd (1995) [78], with maximum LOD of 2.03) [53] contains the putative candidate genes GAD2 and CD25 (IL2RA). GAD2 (10p11) encodes the islet cell specific (65 kDa) form of GAD65, an autoantigen in T1D. Association analysis of a highly polymorphic dinucleotide repeat physically linked to the gene did not support a significant role for GAD2 allelic variation in genetic susceptibility to T1D [79]. In contrast, CD25 (10p15), which encodes the IL-2 receptor α chain, was examined using a tag SNP approach and a large sample size (7,457 cases and controls and 725 multiplex families), with results consistent with a role in TID [80].
CD25 plays a critical role in the development and maintenance of Treg cells and may play a role in Treg cell expression of CD62L, which is required for their entry into lymph nodes [81]. In association studies, T1D was associated with two independent groups of SNPs, spanning overlapping regions of 14 and 40 kb, encompassing the first intron of CD25 and the 5' introgenic region [82-83]. The T1D susceptibility genotypes were also associated with lower circulating levels of soluble IL2RA (s-IL2RA) [82]. Dendrou and colleagues (2009) confirmed gene-phenotype correlation at the RNA level [84]: Individuals with one or two protective alleles (G) at rs12722495 showed an increase in CD25 levels (27%) on their CD4+ memory T cells when compared with homozygous susceptible individuals (AA) or to those with protective rs11594456 or rs2104286 alleles [84]. A gene dosage effect at rs12722495 was also apparent; while heterozygotes had a 22% increase, homozygotes had an increase of 33%. In addition to the changes in CD4+ memory T cells, the protective haplotype at rs12722495 also correlated with phenotypic changes in naive T cells and in stimulated CD14+ CD16+ monocytes.
5.6 Other loci
Other putative diabetes susceptibility loci, initially identified using linkage studies, were localized to the following chromosomes:
1. 18q12-q21, designated IDDM6, maximum LOD 3.7 [78, 85];
2. 6q27, designated IDDM8, maximum LOD 3.4 [55, 78, 86];
3. 3q22-q25, designated IDDM9 in unpublished data by Todd (1995) [78], maximum LOD 2.4 in DR3/DR4 heterozygotes [87-88];
4. 14q24-q31, designated IDDM11, maximum LOD 4.0 (4.6 in families without evidence of HLA linkage to T1D) [89];
5. 2q34-q35, designated IDDM13, maximum LOD 3.3[90];
6. 6q21, designated IDDM15, after application of an extension of identity-by-descent methods as adjacent to HLA, p < 5x10⁻⁵ [91].
The latter locus brings to a total four putative loci on chromosome 6q: IDDM1/HLA, IDDM15, IDDM5, and IDDM8, in that order from centromere to telomere over a distance of about 100cM.
5.7 Linkage analyses of combined datasets and the limits of linkage analyses
By 1998, very large collections of families with T1D were being analyzed, but with only moderate success. Mein et al. (1998) studied 356 affected sib-pair families from the United Kingdom, but found significant linkage only to three regions: IDDM1/HLA, IDDM10/CD25 (10p13; maximum LOD 4.7), and 16q22-24 (maximum LOD 3.4) [87]. Remarkably, most of the previously reported loci were excluded by exclusion mapping at a λs of 3 and a LOD of -2. Similarly, a two-staged analysis of 616 multiplex families from the United Kingdom and the USA identified only IDDM1/HLA (maximum LOD 34.2) as significant by multipoint analysis, and a single previously unreported locus on 1q as of suggestive significance (LOD 3.31) [56]. The data were consistent with a locus distal from the HLA, at IDDM15 (6q21), with a maximum LOD 3.8, but proximity to the HLA requires correction for LD, resulting in an adjusted LOD of 2.27. On chromosome 2q, previous studies had proposed three loci, IDDM7, IDDM12, and IDDM13, but Concannon et al. (1998) reported a maximum LOD of 1.07 in this region, and little evidence for distinct loci [56]. By multipoint analysis, even modest contributions to T1D (λs ≥ 1.5; LOD < -2) could be excluded for IDDM3, IDDM4, IDDM6, IDDM9, and IDDM10. In an identity-by-descent (IBD) analysis of previously reported loci (other than IDDM1/HLA and IDDM2/INS), only IDDM7/IDDM12/IDDM13 and IDDM15 had LOD scores greater than 1; negligible support was found for six of the previously reported loci: IDDM3, IDDM4, IDDM6, IDDM9, IDDM10, and IDDM11.
In an attempt to further increase the power of linkage analyses, multinational consortia were formed, allowing the analysis of combined datasets. The Type 1 Diabetes Genetics Consortium (T1DGC) was established for this purpose in 2002. Concannon et al. (2005) performed, under the auspices of the T1DGC, a combined linkage analysis of four datasets [92], including three previously published [56, 87], providing a total sample of 1,435 families with 1,636 affected sib-pairs. By multipoint linkage analysis, only the HLA was significant (IDDM1; LOD 116; λs of 3.35), and four other regions showed suggestive significance (i.e. uncorrected p < 7.4x10⁻⁴):
1. 2q31-33 (IDDM7/IDDM12/CTLA4; LOD 3.34; λs of 1.19);
2. 6q21 (IDDM15; LOD 22.39; λs of 1.56);
3. 10p14-q11 (IDDM10/CD25; LOD 3.21; λs of 1.12);
4. 16q22-24 (LOD 2.64; λs of 1.19).
LOD scores above 1 were found at IDDM2/INS, and 5 other regions: 3p13-14, 9q33-34, 12q14-12, 16p12-q11.1, and 19p13. The 19p13 region contains the insulin receptor gene (INSR). In 2009, the T1DGC published a linkage analysis of 2,496 multiplex families; again, only the HLA was significant at a genome-wide significance level (IDDM1; LOD 213), with significance at 6q21/IDDM15 resulting from an effect partly due to LD with HLA. Suggestive linkage was found at CTLA4 (IDDM7/IDDM12; LOD 3.28), INS (IDDM2; LOD 3.16), and two regions on chromosome 19: 19p13 (INSR; LOD 2.84) and 19q13 (LOD 2.54) [93]. The sample size of this study provided unprecedented power to detect linkage, but provided little support for the majority of loci previously implicated in T1D.
Although the relative risk ratio of disease in siblings of patients of T1D is about 15, the contribution of HLA is a λs of 3.6 and that of non-HLA-linked loci individually significantly lower (generally less than 1.5). As the strength of the effect of the inheritance of any individual T1D susceptibility allele on disease phenotype is only modest, they are difficult to detect by linkage analysis. Genome-wide linkage analysis of thousands of affected sib-pair families would be required to robustly detect all genes with effects on familial clustering similar to the INS locus [94]. A consequence of this is that recruitment must, by necessity, require international collaboration and pooling of samples across geographic boundaries. This would however result in a loss of the ability to detect susceptibility genes associated with local differences in the genetic population structure or environmental conditions. An additional limitation of genome-wide linkage analysis is that the resolution at which a locus is identified is limited by the relatively low frequency of recombinations occurring between generations. Even with large collections of families, a genome-wide linkage scan is unlikely to map a locus to less than a 5cM resolution, which is generally insufficient to identify the causal gene. As a consequence of these two factors, even in the case of loci that were identified by linkage, replication at genome-wide levels of significance by linkage was difficult, and robust confirmation generally required a positional candidate approach and a candidate-specific association study. By the mid 2000's, association studies had confirmed likely roles for HLA, INS, PTPN22, CTLA4, and CD25.
6. Genome-wide association studies (GWAS) of type 1 diabetes
Genome-wide linkage analyses are limited in resolution by the recombination frequency observable over a few generations, and in power by the relatively low number of multiplex families available. By the year 2000, a reasonable draft of the human genome sequence was completed, millions of SNPs had been deposited into public databases, and high throughput technologies were under development for SNP genotyping. It was predicted that case control association studies involving thousands of patients and population-based controls would provide far better resolution and power for the identification of disease-associated genes [95]. In contrast to linkage studies, association studies can detect alleles with much more modest effects on risk as long as those alleles are relatively common and the sample size is sufficiently large [96]. In each region of the genome, preselected SNPs are chosen that are expected to represent the total genetic variation in LD with the markers (termed tag SNPs). Kruglyak (1999) estimated that in whole genome association studies, LD was unlikely to extend beyond an average distance of 3kb in the general population [97]. This implies that a minimum of 500,000 SNPs would be required for whole genome analysis.
Smyth and colleagues (2006) performed a multi-locus case-control association study of T1D using >6,500 coding, non-synonymous (ns) SNPs [98]. Although not discussed in the paper, the rationale for studying nsSNPs, was the expectation that most alleles affecting common, complex diseases would alter the coding sequence, and therefore the causal variants might be amongst the markers selected [99]. The study was underpowered with ~2,000 cases and 1,700 control samples, and, described as an "interim analysis", was not corrected for multiple hypothesis testing. The most significantly associated SNP was the previously published and confirmed C1858T SNP in PTPN22 [40].
6.1 IFIH1
The next two most significantly associated SNPs reported in Smyth and colleagues (2006) were in CAPSL (5p13), which is adjacent to IL17R, and on chromosome 2q24.3 in IFIH1 (interferon induced with helicase C domain 1; also known as MDA5 or Helicard; risk associated SNP rs1990760) [98]. The association with rs1990760 was strengthened by genotyping an additional ~2,500 cases and ~4,500 controls and by examining an independent collection of parent-child trios. The IFIH1 protein functions as a pattern recognition receptor for viral dsRNA. Additional SNPs in the region were typed and the region boundaries were found to include three other genes: fibroblast activation protein (FAP), grancalcin (GCA), and a potassium voltage-gated channel and subfamily H member 7 (KCNH7). Liu and colleagues (2009) confirmed the association of these genes within the IFIH1 LD block, and identified a significant genotype-expression correlation between IFIH1 and four SNPs within (rs1990760 and rs2111485) and at the 3' end of the IFIH1 gene (rs13422767 and rs2111485) [100]. Here, the most significant p-values were obtained for two SNPs within the IFIH1 gene (p = 8 × 10⁻⁸ and 4 × 10⁻⁶ for rs1990760 and rs2111485, respectively). With the benefit of hind-sight, variation in any, or a combination, of these genes could possibly affect T1D.
The Wellcome Trust Case Control Consortium (WTCCC; 2007) published a major genetic milestone in 2007: a genome-wide association study (GWAS) of seven complex diseases (bipolar disorder, coronary artery disease, Crohn's disease, rheumatoid arthritis, T1D and type 2 diabetes), with about 2,000 cases per disease, and a shared group of ~3,000 controls, typed at 500,568 SNPs using the Affymetrix GeneChip500k Mapping Array Set [101]. Prior to the genome-wide analysis of the data set, the authors examined associations at loci previously identified, and confirmed by association. For T1D, they confirmed associations for HLA, CTLA4, PTPN22, CD25, and IFIH1; INS could not be tested because a suitable SNP was not identified. It is sobering to note that the p-values obtained for these "proof of principal" associations only exceeded the genome-wide significance level for HLA and PTPN22. Even more concerning was the finding that, even after raising the threshold for significance 500-fold, the only other previously reported genetic region identified was CD25. The study did, however, identify three new loci significantly associated with T1D: 12q13, 12q24, and 16p13. In a follow-up study, the WTCCC genotyped an additional 4,000 cases and 5,000 controls (total 6,000 affected, 6,200 controls) and confirmed significance for 12q24 (gene SH2B3), 12q13 (ERBB3), 16p13 (CLEC16A), and 18p11 (PTPN2) [102].
6.2 SH2B3
At 12q24, the most highly associated SNP lay within exon 3 of SH2B3, although the marker is in the middle of a >1.2Mb LD block that encodes several other proteins, including NAA25 (N(alpha)-acetyltransferase 25), which is encoded by C12orf30. SH2B3 is a key negative regulator of cytokine signaling and plays a critical role in hematopoiesis.
6.3 ERBB3
Remarkably, SH2B3 binds the receptor tyrosine kinase ERBB3 (v-erb-b2 erythroblastic leukemia viral oncogene homologue 3 (avian)), the gene for which lies in 12q13 and contains a highly associated SNP in its sixth intron. The genotypes associated with T1D produce lower ERBB3 mRNA expression and reduced ERBB3 expression on TLR-activated dendritic cells and monocytes and a lower ability to stimulate T cell proliferation [103]. This locus was subsequently independently identified in the T1DGC and Canadian replication cohorts by Hakonarson et al. (2008) [104].
6.4 CLEC16A
The most strongly associated SNP in 16p13 is located within intron 18 of CLEC16A, although the LD block is flanked by two potentially stronger candidates: CIITA (activator of MHC class II transcription) and SOCS1 (suppressor of cytokine signaling). Independently of the WTCCC, a Canadian group identified the same locus in a combined TDT/case-control association study with 483 family trios and 563 patients and 1,146 controls of European ancestry [105]. At a genome-wide level of significance, they confirmed association at HLA, PTPN22, and INS, and identified a novel locus at 16p13, where three noncoding variants were in strong LD. The minor allele was protective with an odds ratio of ~0.65. Confirmation was obtained by TDT on 549 T1DGC (Type 1 Diabetes Genetics Consortium) families and additional 390 Canadian trios. In their hands, the locus resides in a LD block that contains the single gene: CLEC16A. CLEC16A is expressed on B lymphocytes, natural killer (NK) cells, and dendritic cells [105], but is of unknown function; it is unlikely to be a lectin because its C-type lectin domain is only 20 amino-acids long.
6.5 PTPN2
PTPN2 encodes a phosphatase that dephosphorylates STAT1. STAT1 regulates immune signaling, including in the IL-2 pathway. Sequencing failed to identify any coding variants or mutations likely to affect splicing; the two most significantly associated SNPs were located in introns 3 and 7. In addition, Smyth and colleagues revisited some loci that interested them in their association study of nsSNPs [98]. By combining data from the original study, follow-up typing of 2,700 patients, 3,500 controls, and 2,997 family trios, genome-wide significance levels were reached for PTPN22, IFIH1, and CD226.
6.6 CD226
CD226 encodes the immune receptor DNAM-1, which is expressed on NK cells, platelets, monocytes, and a subset of T cells. It mediates adhesion to vascular endothelial cells via binding the cell adhesion molecule nectin-2 (CD112), and NK cell cytotoxicity via binding nectin-2 and PVR (CD155) on target cells [106-107]. Dendritic cells also express poliovirus receptor (PVR), and its interaction with DNAM-1 provides T cell costimulation that is important during Th1 cell priming [108], CD8 T cell priming, and cytotoxicity [109].
Another GWAS was published in 2008 [110], with seven of its eleven authors shared with the WTCCC follow up study [102]. It combined analysis of 3,561 cases and 4,646 controls from Britain (1,960 primarily pediatric cases and 2,942 controls from the WTCCC) and the US (1,601 adult, generally elderly, cases from the US Genetics of Kidneys in Diabetes study and 1,704 controls from the National Institute of Mental Health). Of the previously identified loci, they confirmed the following genes at a genome-wide level of significance: HLA, PTPN22, NAA25 (C12orf30), ERBB3, CLEC16A, and CTLA4. The combined analysis also identified a significant region on 4q27, with the most significant SNP located in the gene KIAA1109, which lies about 200 kb 3' of the IL2 and IL21 cytokine genes, and is of particular interest because it is syntenic with the NOD mouse diabetes susceptibility gene Idd3 [111].
No other loci reached genome-wide significance. However, by combining these data sets with additional 6,225 cases and 6,946 controls from Britain (presumably the original WTCCC cohort) four new loci were identified: 6q15 (in the gene BACH2), 10p15 (PRKCQ), 15q24 (CTSH), and 22q13 (C1QTNF6).
6.7 BACH2
The most strongly associated SNP in 6q15 lies within the third intron of BACH2, which encodes BACH2, a bZIP transcription factor. Like IFIH1, BACH2 has a role in nucleic acid-triggered innate antiviral responses, including programmed cell death of infected cells [112].
6.8 PRKCQ
The gene PRKCQ lies 79 kb telomeric to the most significantly associated SNP in 10p15 and encodes protein kinase C, θ (PKC-θ). Like PTPN22, PKC-θ is involved in T cell signaling. It is a calcium-independent and phospholipid-dependent protein kinase which links TCR activation to NF-κB translocation by phosphorylation of CARD11, Jun activation by phosphorylation of STK39/SPAK, and calcium mobilization by regulating inositol 1,4,5-trisphosphate generation.
6.9 CTSH
The most significantly associated SNP in 15q24 is located in intron 1 of CTSH, which encodes cathepsin H, a lysosomal cysteine proteinase. The LD block contains eight other genes.
6.10 C1QTNF6
On chromosome 22q13, the most strongly associated SNP lies between C1QTNF6 (C1q and tumor necrosis factor related protein 6) and SSTR3 (somatostatin receptor 3). The LD block contains two other genes.
A combined meta-analysis, incorporating cases from the WTCCC studies [102] and the combined British and US GWAS [108], examined a total sample set of 7,514 cases and 9,045 reference samples [113]. At a genome-wide level of significance, they confirmed associations with the previously identified regions 1p13 (gene of interest PTPN22), 2q24 (IFIH1), 2q33 (CTLA4), 4q27 (IL2), 6q15 (BACH2), 10p15 (IL2RA and PRKCQ), 11p15 (INS), 12q13 (ERBB3), 12q24 (SH2B3), 15q25 (CTSH), 16p13 (CLEC16A), 18p11 (PTPN2), 21p22 (UBASH3A), and 22q13 (C1QTNF6). In addition, they obtained genome-wide significance for 18 other loci, including those described in the following sections.
6.11 IL10
The most significantly associated SNP at 1q32 (rs3024505) is distal to the IL10 gene. IL10 has pleiotropic effects on adaptive and innate immunity. Its ability to inhibit the production of several inflammatory cytokines and chemokines, including IL1 and TNF, contribute to its anti-inflammatory activities. It inhibits expression of MHC class II antigens, and the costimulators CD80 (B7) and CD86 (B7.2) on monocytes, significantly affecting their T cell-activating capacity. In contrast, it enhances survival and proliferation of B cells and increases antibody production [114].
6.12 CD69
CD69 is encoded at 12p13. Its expression is induced upon T cell activation and mediates T cell costimulation. The most significantly associated SNP is in the first intron, which contains a cis-regulatory element [115]. Significantly, CD69 suppresses sphingosine 1-phosophate receptor-1 (S1P1) function [116]. S1P1 plays a critical role in lymphocyte recirculation; its pharmaceutical downmodulation by the agonist fingolimod sequesters lymphocytes in lymph nodes, preventing diabetes in NOD mice [117-118].
6.13 IL27
The most significantly associated SNP at 16p11 lies in a 30kb intragenic region between NUPR1 and IL27; it is 5' of IL27. IL27 causes clonal expansion of naive CD4 T cells without affecting memory cells. It synergizes with IL12 to incite the production of IFNγ.
6.14 GLIS3
The most significantly associated SNP at 9p24 is in the first intron of GLIS3. GLIS3 is a nuclear protein with five zinc finger domains and modulates transcription. It is involved in the development of pancreatic beta-cells, the thyroid, eye, liver, and kidney. Mutations in its gene have been associated with neonatal diabetes.
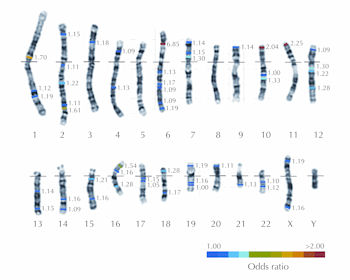
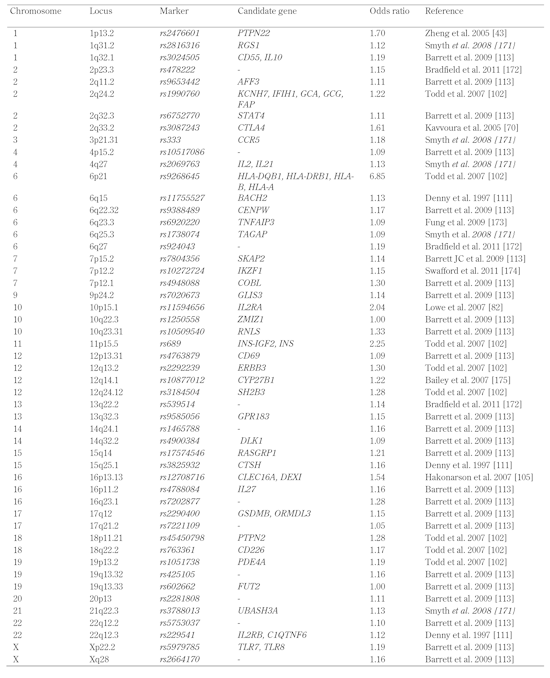
The other regions identified were: 4p15, 6q22 (associated gene of interest C6orf173), 7p15, 7p12 (COBL), 10q23 (C10orf59), 14q24, 14q32, 16q23, 17q12 (ORMDL3), 17q21, 19q13, 20p13, 22q12, and Xq28. A summary of significant T1D susceptibility loci is provided in Figure 1 and Table 2.
 |
|
Figure 1. Karyotype illustrating major T1D loci. A human karyotype illustrating the 22 autosomes and two sex chromosomes with the locations of the major T1D susceptibility genes indicated by color bars. The colors indicate the approximate odds ratios of the risk alleles at each locus. The details of each locus are provided in Table 2. |
|
Table
2.
T1D susceptibility genes illustrated in Figure 1 |
|
 |
|
7. From location to molecular mechanisms: the missing heritability problem
Heritability, the proportion of phenotypic variation within a population that is explained by genetic variation, has been estimated for T1D on the basis of familiar concordance. Family studies, including twin studies, allow comparisons of the prevalence of disease amongst relatives of affected individuals with that in the broader population. High-power, high-resolution, genome-wide searches for the genetic variants responsible for the genetic component of liability (termed susceptibility) to T1D have identified dozens of genetic regions that contribute to the risk of disease. With the exception of the HLA, generally each locus makes a relatively small contribution to the overall risk. Comparisons of family-based estimates of heritability, with estimates of aggregated (generally additive) genetic risk, have identified the cause of only ~14% of the heritability of T1D [119]. This deficiency has been referred to as "missing heritability" or the "heritability gap" [120], and is common to the GWAS results of almost every complex trait, suggesting a systematic problem [120]. Several explanations for this problem have been proposed [121-122] and are discussed here.
7.1 Misdiagnosis
An assumption underlying genetic studies in autoimmune diseases is that each clinical syndrome represents a single disease entity, with a shared etiology. Diagnostically, the major confusion with T1D is caused by the existence of two other diabetes forms:
1. Latent autoimmune diabetes, which is of later onset;
2. Type 2 diabetes, which does not have an autoimmune origin (and therefore lacks anti-islet autoantibodies), but is common and of increasing prevalence.
The application of new diagnostic methods, such as detailed immunophenotyping and new imaging modalities, will improve clinical classification.
7.2 Familial environmental differences
Heritability compares variation in disease within families with that in the broader community, and assumes that these differences are due to genetic inheritance. In reality, inheritance consists of a great deal more than genome. Many other factors are more common to family members than to the broader community, including prenatal environment, geographic location, domestic environment, diet, diurnal patterns, hobbies, work activities, socioeconomic status, etc. It is therefore obvious that the component of liability attributed to "heritability" incorporates a great number of environmental causes.
Epidemiological approaches have identified multiple associated environmental factors that are neither homogenously distributed in populations, nor corrected for in heritability estimates, such as socioeconomic status, urban/rural location [123-126], and dietary habits [127-128]. For some diseases, it is possible to estimate the contribution of such factors by comparing disease prevalence in monozygotic twins raised together with that of those raised separately. In the case of T1D, the prevalence of the disease is sufficiently low as to virtually exclude this form of analysis. Progress in our understanding of the genetic etiology of T1D therefore remains heavily dependent on rigorous epidemiological studies. The incorporation of epidemiological data into genome-wide studies is computationally simple, but remains to be applied systematically.
7.3 Gene/environment interactions
Our genetic understanding of complex diseases is strongly influenced by the modeling performed by Falconer [129-130], which assumed that large numbers of genetic and environmental factors each contribute a small risk in an additive fashion. Falconer's model has proved robust in the calculation of familial risk for T1D [131]. Nevertheless, it is likely that loci exist for which the phenotypic effects of allelic variation are dependent on the presence or absence of one or more environmental factors, or for which environmental risk factors are synergistic. The resolution of this issue will require the incorporation of epidemiological data into computationally demanding genome-wide interaction analyses (GWIA).
7.4 Epistasis: gene/gene interactions
Similar in effect to gene/environment interactions, epistasis can diminish the apparent effects of causal variations. For example, many biochemical pathways show significant degrees of redundancy and, as a result, multiple genes with shared activity may need to be affected for a phenotype to be observable. Epistasis can be identified by GWIA, but this generally requires larger data sets, is computationally challenging, and currently lacks clear guidelines for significance thresholds [132]. A greater understanding of the molecular mechanisms involved in autoimmunity is likely to facilitate identification of synergism and redundancies, but as a generalization, this is dependent on identifying the functional variants responsible for conferring risk.
7.5 Epigenetic inheritance
Methylation of cytosine bases in DNA is a mechanism of epigenetic marking. It can be analyzed on a genomic scale at single base-pair resolution [133]. As far as we know, the primary mechanism by which epigenetic marking affects phenotype is by modulating transcript expression levels. The effects of epigenetic inheritance can therefore be assessed more broadly by mRNA analyses using microarrays or high throughput sequencing (HTS). These methods depend on the knowledge of the relevant transcripts. Some may be indicated by the locations of risk-associated SNPs, which frequently lie in untranslated sequences either side of protein coding open reading frames (ORF), or else in introns. In many cases, however, it is unclear which protein coding region(s) should be targeted for transcription studies.
The possibility that epigenetic modifications are responsible for missing heritability was discussed by Slatkin (2009) [134]. He points out that their effects depend on the frequency of gain, and the rate of loss, of inherited epigenetic marks, which we are currently unable to estimate. His numerical analyses indicated that unless epigenetic marks persist for many generations, they are unlikely to contribute much to missing heritability, although they may well contribute to causality.
7.6 Inheritance of copy number variations
Copy number variations (CNVs) of chromosomal segments up to 2Mb are widespread across the human genome [135], and affect function either through haploinsufficiency or by gene duplication, which enhances message levels. CNV can affect phenotypes and cause rare Mendelian disease traits such as Charcot-Marie-Tooth disease [136] and hereditary neuropathy [137]. It has also been shown to be associated with multiple complex diseases.
Two GWAS of CNVs have been performed for T1D [138-139]. Both studies identified significantly associated CNV at the HLA. The WTCCC reported two additional CNVs significantly associated with other complex diseases, but commented that all three loci had been previously identified by GWAS of SNPs, indicating that SNPs in LD with CNV could act as tags for them just as SNPs can be used to tag other causal variations. Previous SNP-based GWAS therefore had indirectly explored CNVs for associations with disease. The consortium concluded that common CNVs that can be typed on existing platforms are unlikely to contribute greatly to the genetic basis of common human diseases. Grayson's much smaller 2010 study identified eleven CNVs that differed in frequency by 1.5-fold between twenty patients with T1D and twenty healthy controls, and varied between ten pairs of monozygotic twins discordant for T1D. Replication studies of an independent sample (73 patients and 73 controls) failed to validate any of these candidates [139].
7.7 Ineffective haplotype tagging
As a generalization, most risk SNPs identified by GWAS are just tagging SNPs in LD with the causal variants, which are yet to be identified. Their value in risk assessment is only as strong as their association with the causal variant(s). In 2001, analyses by Daly et al. (2001) [140] and Jeffreys et al. (2001) [141] suggested that the human genome consists of discrete haplotype blocks of tens to hundreds of kilobases, each with limited diversity, separated by recombination hot spots. The International HapMap Project is testing the haplotype block model of LD by identifying common haplotypes in four racial groups from different parts of the world, and by identifying tag SNPs that uniquely identify these haplotypes (http://hapmap.ncbi.nlm.nih.gov/whatishapmap.html.en). If successful, genotyping of the 300,000 to 600,000 tag SNPs in individuals could identify their haplotype blocks and therefore the majority of the sequence of their genome. As HapMap data have become available, they have been applied to GWAS on the assumption that tag SNPs adequately represent the genetic diversity of an individual [142]. This assumption may not be true, as the maximum opportunity for diversity lies in the recombination hot spots. The assumption can only be tested by whole genome sequencing of patients and controls, or targeted resequencing of haplotype blocks, including the flanking recombination hot spots. With current technologies, whole genome sequencing results in ~300,000 private mutations (de novo mutations or familial mutations) and a similar number of sequencing errors. Interpretation will require improved computational methods for management of errors and better methods for identifying regulatory sequences.
The possibility that ineffective haplotype tagging is responsible for missing heritability in GWAS studies was analyzed by Spencer et al. (2011) [143]. They concluded that under plausible assumptions, the majority of the per-allele relative risk (RR) estimated from GWAS data will be close to the true risk at the causal variant. Nevertheless, some per-allele RRs could be considerable underestimates; for an estimated RR in the range 1.2-1.3, there is a ~38% chance that it exceeds 1.4, and a 10% chance that it is over 2. Although these effects mean that the amount of heritability explained by known risk loci is probably larger than current projections, this factor is unlikely to explain much of the missing heritability.
7.8 Rare variants
The GWAS approach relies on the use of contingency table analyses to identify significant deviations from expected allele frequencies. These tests are most useful when frequencies are in the mid range; they perform badly with very low expected frequencies. The GWAS approach requires a compromise, which is implied in the "common disease, common variant" hypothesis, in which it is postulated that common diseases are largely attributable to common alleles present in >1-5% of the population. It could be argued that the heritability gap indicates that the hypothesis is found deficient, and that much of the heritability of T1D is conferred by rare alleles, the identification of which will require larger study populations. Population genetic theory predicts that variants conferring a large proportion of disease risk will be associated with decreased reproductive fitness, which should act to reduce their frequencies [120]. This raises the hypothesis that some rare alleles will confer a large proportion of heritability. Although certainly possible, this hypothesis is also one of convenience; if the missing heritability is conferred by large numbers of rare alleles of weak effect, they cannot be practically identified by genetic means. Even if missing heritability is explained by rare alleles of large effect, it may be difficult to identify many of them. Current GWAS studies of T1D require large multinational collaborations to obtain sufficiently large numbers of samples for analysis. As a consequence, loci with contributions dependent on local environmental conditions are usually undetectable. This will be an even greater problem with larger studies.
The issue of rare variants is related to that of ineffective haplotype tagging. High throughput sequencing has facilitated complex-trait rare-variant association studies. In some cases, fine mapping identified multiple independent rare variants that contributed to the GWAS association between the tagging SNP and disease [144]. Ehret et al. (2012) have developed a method for improving the tagging of unobserved causal variants by using a combination of SNPs to define a haplotype [145]. This multi-SNP association method is capable of substantially increasing the amount of variance explained (for example from 3% to 13% for height). Also, it increases the proportion of loci capable of being replicated in a validation study. A detailed analysis showed that most of the additional variability explained is derived from SNPs that are not in LD with the lead tagging SNP, confirming that allelic heterogeneity contributes to missing heritability.
7.9 Common variants of low effect
For almost all complex traits, it has been observed that the greater the power of a GWAS to identify genes with low contributions to risk, the more genes are found. Extrapolation of these data resulted in the hypothesis that virtually all genes contribute to a trait, with increasingly large numbers contributing steadily diminishing amounts of risk. This has led to the suggestion that substantially larger GWAS will be required to identify the majority of heritability. Park et al. (2010) applied empirical data to assess the number of loci that are likely to be associated with a given complex disease, and the distribution of their effect sizes [146]. They argue that the distribution of effect sizes seen in current GWAS is skewed because of a bias in favor of larger effect sizes, for which their power is greater. When this bias was corrected for, the predicted number of loci discovered increased roughly in proportion to sample size, but the proportion of genetic variance explained by these loci showed diminishing returns. Their model predicted that, while increasing the sample size of a GWAS for Crohn's disease from 5,000 patients and a similar number of controls by five-fold would increase the number of loci identified by a similar factor, it would not even double the proportion of heritability explained [146].
7.10 Missing association
A specific class of missing heritability is provided by disease risk loci identified and confirmed by linkage, but not identified by association studies. For example, IDDM4/FGF3 had been confirmed by linkage according to the guidelines proposed by Lander and Kruglyak [54], yet showed no association with T1D in any of the major GWAS. Clearly, this cannot be a result of either misdiagnosis or familial environments. It could theoretically result from gene/environment interactions, but Luo et al. examined the proportions of gene sharing between individual cohorts sourced from Florida, other parts of the USA, and Italy, without finding differences [55]. As discussed above, copy number variations should be adequately tagged by association studies [138], and although IDDM4 makes a relatively low contribution to susceptibility (λs = 1.09) [147], large association studies should have more power to detect genes than relatively small linkage studies.
There is evidence that ineffective haplotype tagging may contribute to the difficulty in identifying IDDM4 in GWAS studies. Fine mapping by transmission disequilibrium testing (TDT) of over 2000 families pooled from the UK, USA, Norway, Sardinia, Romania, Finland, Italy, and Denmark indicated that the true IDDM4 linkage peak lies in a region more centromeric than FGF3 (containing D11S1917 and D11S1337), and identified a two-marker haplotype that was most strongly associated with T1D (D11S1917*03-H0570polyA*02) [147-148]. Twells et al. (2003) subsequently developed a comprehensive SNP map of the region concentrated on the positional candidate gene LRP5 [149]. The map included 95 SNPs over 269kb of genome, saturating LRP5 with 32 microsatellite markers and 12 SNPs. It could identify the risk-associated D11S1917*03-H0570polyA*02 haplotype with a combination of four SNPs. The implication is therefore that this haplotype could not have been identified by a single tag-SNP GWAS approach.
Despite the development of a high-resolution map of the region and the incorporation of multi-locus haplotyping, Twells et al. failed to improve the existing strength of the association with T1D. Furthermore, analysis of an independent, Finnish data set showed no significant deviation of transmission of the risk-associated four-SNP haplotype [149]. One potential explanation for these results (in addition to the possibility that IDDM4 does not represent a genuine disease locus) is that linkage of the region to T1D may be mediated by familial transmission of rare or private variants. Tumor biology provides a useful analogy; although BRCA1 and BRCA2 show linkage to breast and prostatic cancer, 670 different protein-truncating mutations have been reported for BRCA1 and over 730 for BRCA2 [150]. Some of these mutations, such as the 5382insC frameshift mutation in exon 20 of BRCA1 are relatively common, occurring in about 10% of heritable breast cancers; many others have only ever been reported once [150].
There is no a priori reason why a similar pattern of mutation should not be found for genes conferring susceptibility to autoimmunity. If so, the ability of GWAS to identify such loci will be dependent on the dominance of one, or a few common mutations. Complete characterization of loci identified by linkage, but not association, will require comprehensive resequencing.
8. From genes to function
The GWAS approach tests disease associations with individual variants that are unlikely to be causal. Many of the applications of GWAS data, and many of the strategies for identifying missing heritability described above, are dependent on identifying the functional variants not just the tagging SNPs with which they are in LD. One approach is to examine protein-coding genes in the vicinity of risk SNPs to identify overrepresented biological pathways. For example, the recent GWAS data obtained for multiple sclerosis were analyzed for the enrichment of genes (defined as protein-coding regions nearest to the lead-tagging SNP) with similar function, as defined by their classification in the Gene Ontology (GO) database [151]. The GO terms having the most significant enrichment included genes involved in 'immune system processes' (p = 8.6x10⁻¹¹, OR = 9.12), particularly lymphocyte function (p = 3.2x10⁻¹¹, OR = 35.96), and especially T cell activation and proliferation (p = 1.85x10⁻⁹, OR = 40.85) [152].
Similarly, pathway databases, such as the Kyoto Encyclopedia of Genes and Genomes (KEGG) [153], can be used to cluster candidate genes into higher-level functions, disease processes, and organism behaviors. Li et al. (2012) [154] applied this approach to the Wellcome Trust Case Control Consortium (WTCCC; 2007) [101] dataset. Significantly over-represented pathways in T1D included the Jak-STAT, calcium, MAPK, and Wnt signaling pathways, as well as tryptophan and pyrimidine metabolism. Once associated functions and pathways have been identified, one can return to the genomic sequence flanking risk SNPs to identify additional putative causal variants. The sequencing of these SNPs, and their associated regulatory sequences, in patients and controls can help to validate these candidates.
These approaches have provided partial success, but have made it clear that few causal variants affect the amino acid sequence of candidate protein coding regions. In many cases, the haplotype block in LD with a tagging SNP lies within the first intron, or in regulatory sequences 5' or 3' of a protein-coding gene. Usually, the most important regions that regulate transcription are the promoter and the first intron, although many other regulatory elements are also required for spatiotemporally and quantitatively correct gene expression; enhancer and repressor elements frequently reside in introns or up- and downstream of the transcription unit [155]. This finding therefore suggests that the linked causal variants in these regions are likely to be expression quantitative trait loci (eQTL), at which polymorphism affects the expression of one or more transcripts. Indeed, the data obtained on candidate genes for several autoimmune diseases strongly support the hypothesis that most of the genetically encoded risk of disease is conferred by eQTL [38, 71, 103, 156-163].
The success of eQTL-based approaches is illustrated in recent studies which combine genotyping and gene expression datasets. For example, Göring et al. (2007) reported that, of around 20,000 autosomal gene transcripts, 1,345 were regulated by nearby (cis) gene variants [164]. With a false discovery rate of 5%, the median genotype-expression change was 24.6%. In a dataset combining very high density SNP genotyping and gene expression profiling of lymphoblast cell lines from 210 unrelated individuals, Veyrieras et al. (2008) found that, of 11,466 expressed genes, expression levels in 6.5% of these were highly associated with individual SNPs [165]. The most significantly associated eQTL was an average of 7.5 kb from the transcript, and 99% of cis-eQTLs were found to lie between 110kb upstream and 40 kb downstream of the transcription start site.
It is likely that eQTLs and splice QTLs will be cell subset-specific. Dimas et al. (2009) identified eQTL in three cell types (fibroblasts, EBV-transformed B cells, and T cells) in 75 newborns enrolled in a European Gencord project [166]. Of 1,007 unique eQTLs, only 8.5% were shared amongst all three cell types, 12% were shared between two of three cell types, and 79.5% were cell type-specific. It is therefore necessary for cell subsets to be analyzed for gene expression profiles individually. A significant advantage for T1D is that much of the disease risk appears to be conferred by genes involved in immune system processes, particularly leukocyte function, and a wide range of leukocytes can be accessed via the peripheral blood using commercially available kits that facilitate subset purification from whole blood or buffy coat. A proof of principle for this approach was provided by the integration of SNP genotyping and peripheral blood monocyte expression data in which allelic variation at the T1D susceptibility locus 12q13 (ERBB3; lead SNP rs11171739) was associated with differences in expression of two nearby (cis) genes, RPS26 and SUOX, and 5 trans genes, including MADCAM1 [167]. There is significant evidence that modulation of MAdCAM-1 expression affects the pathogenesis of T1D; it is increased in expression on vascular endothelium adjacent to and within the inflamed islets of NOD mice [168], and its blockade reduces the incidence of spontaneous diabetes [169] and diabetes transferred by a T cell clone in mice [170].
Our preferred approach is to identify disease-associated eQTL in five peripheral blood leukocyte subsets: CD4 T cells, CD8 T cells, B cells, NK cells, and monocytes. By combining this data set with T1DGC GWAS data (www.t1dbase.org), we will be able to identify variants that are associated with differences in gene expression throughout the genome, whether in cis or trans. Some of these variants will also be associated with disease. These studies will dramatically increase our knowledge of each of these risk-associated haplotypes that contain eQTL; they will reveal the following aspects:
1. The transcripts that the haplotypes cause to be differentially expressed;
2. The tissues in which the differential expression occur;
3. The direction of differential expression the haplotypes confer;
4. The direction of changes in expression associated with disease.
With these four critical pieces of information, we can generate animal models to test the validity of these candidate genes and thus determine the molecular mechanisms of their actions.
Disclosure: The authors report no conflict of interests.
Acknowledgments:
This work was supported by the Australian Research Council and the National Health and Medical Research Council (NHMRC) of Australia. AGB is supported by and NHMRC Senior Research Fellowship. MAJ is supported by an NHMRC Early Career Fellowship. We are grateful to our friends and colleagues for discussions, including Helmut Butzkueven, Grant Morahan, and Thomas Brodnicki, and would like to thank Benjamin Crowley for assistance.
References
- Johnston C, Millward BA, Hoskins P, Leslie RD, Bottazzo GF, Pyke DA. Islet-cell antibodies as predictors of the later development of type 1 (insulin-dependent) diabetes. A study in identical twins. Diabetologia 1989. 32:382-386. [DOD] [CrossRef]
- Bonifacio E, Bingley PJ, Shattock M, Dean BM, Dunger D, Gale EA, Bottazzo GF. Quantification of islet-cell antibodies and prediction of insulin-dependent diabetes. Lancet 1990. 335:147-149. [DOD] [CrossRef]
- Tillil H, Köbberling J. Age-corrected empirical genetic risk estimates for first-degree relatives of IDDM patients. Diabetes 1987. 36:93-99. [DOD] [CrossRef]
- Pociot F, McDermott MF. Genetics of type 1 diabetes mellitus (Review). Genes Immun 2002. 3:235-249. [DOD] [CrossRef]
- Hyttinen V, Kaprio J, Kinnunen L, Koskenvuo M, Tuomilehto J. Genetic liability of type 1 diabetes and the onset age among 22,650 young Finnish twin pairs: a nationwide follow-up study. Diabetes 2003. 52:1052-1055. [DOD] [CrossRef]
- Kumar D, Gemayel NS, Deapen D, Kapadia D, Yamashita PH, Lee M, Dwyer JH, Roy-Burman P, Bray GA, Mack TM. North-American twins with IDDM. Genetic, etiological, and clinical significance of disease concordance according to age, zygosity, and the interval after diagnosis in first twin. Diabetes 1993. 42:1351-1363. [DOD] [CrossRef]
- Onkamo P, Väänänen S, Karvonen M, Tuomilehto J. Worldwide increase in incidence of type I diabetes - the analysis of the data on published incidence trends. Diabetologia 1999. 42:1395-1403. [DOD] [CrossRef]
- Ziegler AG, Pflueger M, Winkler C, Achenbach P, Akolkar B, Krischer JP, Bonifacio E. Accelerated progression from islet autoimmunity to diabetes is causing the escalating incidence of type 1 diabetes in young children. J Autoimmun 2011. 37:3-7. [DOD] [CrossRef]
- Long AE, Gillespie KM, Rokni S, Bingley PJ, Williams AJ. Rising incidence of type 1 diabetes is associated with altered immunophenotype at diagnosis. Diabetes 2012. 61:683-686. [DOD] [CrossRef]
- Gorer PA. The genetic and antigenic basis of tumour transplantation. J Pathol Bacteriol 1937. 44:691-697. [DOD] [CrossRef]
- Gorer PA, Lyman S, Snell GD. Studies on the genetic and antigenic basis of tumour transplantation - linkage between a histocompatibility gene and “fused” in mice. Proc R Soc Lond B Biol Sci 1948. 135:499-505. [DOD] [CrossRef]
- Dausset J. Iso-leuco-anticorps. Acta Haematol 1958. 20:156-166. [DOD] [CrossRef]
- van Rood JJ, Eernisse JG, van Leeuwen A. Leucocyte antibodies in sera from pregnant women. Nature 1958. 181:1735-1736. [DOD] [CrossRef]
- Payne R, Rolfs MR. Fetomaternal leukocyte incompatibility. J Clin Invest 1958. 37:1756-1762. [DOD] [CrossRef]
- Nerup J, Platz P, Ortved-Andersen O, Christy M, Lyngsoe J, Poulsen JE, Ryder LP, Nielsen LS, Thomsen M, Svejgaard A. HL-A antigens and diabetes mellitus. Lancet 1974. 2:864-866. [DOD] [CrossRef]
- Bertrams J. The HLA association of insulin-dependent (type I) diabetes mellitus. Behring Inst Mitt 1984. 75:89-99. [DOD]
- Todd JA. Genetic analysis of susceptibility to type 1 diabetes. Springer Semin Immunopathol 1992. 14:33-58. [DOD]
- Cucca F, Lampis R, Congia M, Angius E, Nutland S, Bain SC, Barnett AH, Todd JA. A correlation between the relative predisposition of MHC class II alleles to type 1 diabetes and the structure of their proteins. Hum Mol Genet 2001. 10:2025-2037. [DOD] [CrossRef]
- Noble JA, Valdes AM, Cook M, Klitz W, Thomson G, Erlich HA. The role of HLA class II genes in insulin-dependent diabetes mellitus: molecular analysis of 180 Caucasian, multiplex families. Am J Hum Genet 1996. 59:1134-1148. [DOD]
- Kelly MA, Rayner ML, Mijovic CH, Barnett AH. Molecular aspects of type 1 diabetes. Mol Pathol 2003. 56:1-10. [DOD] [CrossRef]
- Devendra D, Eisenbarth GS. Immunologic endocrine disorders. J Allergy Clin Immunol 2003. 111:S624-S636. [DOD] [CrossRef]
- Valdes AM, Erlich HA, Noble JA. Human leukocyte antigen class I B and C loci contribute to type 1 diabetes (T1D) susceptibility and age at T1D onset. Hum Immunol 2005. 66:301-313. [DOD] [CrossRef]
- Valdes AM, Noble JA, Genin E, Clerget-Darpoux F, Erlich HA, Thomson G. Modeling of HLA class II susceptibility to type 1 diabetes reveals an effect associated with DPB1. Genet Epidemiol 2001. 21:212-223. [DOD] [CrossRef]
- Todd JA, Bell JI, McDevitt HO. HLA-DQ beta gene contributes to susceptibility and resistance to insulin-dependent diabetes mellitus. Nature 1987. 329:599-604. [DOD] [CrossRef]
- Khalil I, d'Auriol L, Gobet M, Morin L, Lepage V, Deschamps I, Park MS, Degos L, Galibert F, Hors J. A combination of HLA-DQ beta Asp57-negative and HLA DQ alpha Arg52 confers susceptibility to insulin-dependent diabetes mellitus. J Clin Invest 1990. 85:1315-1319. [DOD] [CrossRef]
- Atkinson MA, Bowman MA, Campbell L, Darrow BL, Kaufman DL, Maclaren NK. Cellular immunity to a determinant common to glutamate decarboxylase and coxsackie virus in insulin-dependent diabetes. J Clin Invest 1994. 94:2125-2129. [DOD] [CrossRef]
- Baekkeskov S, Aanstoot HJ, Christgau S, Reetz A, Solimena M, Cascalho M, Folli F, Richter-Olesen H, De Camilli P. Identification of the 64K autoantigen in insulin-dependent diabetes as the GABA-synthesizing enzyme glutamic acid decarboxylase. Nature 1990. 347:151-156. [DOD] [CrossRef]
- Gamble DR, Taylor KW. Seasonal incidence of diabetes mellitus. Br Med J 1969. 3(5671):631-633. [DOD] [CrossRef]
- Rudy G, Stone N, Harrison LC, Colman PG, McNair P, Brusic V, French MB, Honeyman MC, Tait B, Lew AM. Similar peptides from two beta cell autoantigens, proinsulin and glutamic acid decarboxylase, stimulate T cells of individuals at risk for insulin-dependent diabetes. Mol Med 1995. 1:625-633. [DOD]
- Palmer JP, Asplin CM, Clemons P, Lyen K, Tapati O, Raghu P, Pauquette TL. 1982. Insulin autoantibodies in insulin-dependent diabetes before insulin treatment. Science 1982. 222:1337-1338. [DOD] [CrossRef]
- Atkinson MA. Molecular mimicry and the pathogenesis of insulin-dependent diabetes mellitus: still just an attractive hypothesis. Ann Med 1997. 29:393-399. [DOD] [CrossRef]
- Kent SC, Chen Y, Bregoli L, Clemmings SM, Kenyon NS, Ricordi C, Hering BJ, Hafler DA. Expanded T cells from pancreatic lymph nodes of type 1 diabetic subjects recognize an insulin epitope. Nature 2005. 435:224-228. [DOD] [CrossRef]
- Kennedy GC, German MS, Rutter WJ. The minisatellite in the diabetes susceptibility locus IDDM2 regulates insulin transcription. Nat Genet 1995. 9:293-298. [DOD] [CrossRef]
- Barratt BJ, Payne F, Lowe CE, Hermann R, Healy BC, Harold D, Concannon P, Gharani N, McCarthy MI, Olavesen MG, et al. Remapping the insulin gene/IDDM2 locus in type 1 diabetes. Diabetes 2004. 53:1884-1889. [DOD] [CrossRef]
- Bell GI, Horita S, Karam JH. A polymorphic locus near the human insulin gene is associated with insulin-dependent diabetes mellitus. Diabetes 1984. 33:176-183. [DOD] [CrossRef]
- Julier C, Hyer RN, Daviews J, Merlin F, Soularue P, Briant L, Cathelineau G, Deschamps I, Rotter JI, Froguel P. Insulin-IGF2 region on chromosome 11p encodes a gene implicated in HLA-DR4-dependent diabetes susceptibility. Nature 1991. 354:155-159. [DOD] [CrossRef]
- Bain SC, Prins JB, Hearne CM, Rodrigues NR, Rowe BR, Pritchard LE, Ritchie RJ, Hall JR, Undlien DE, Ronningen KS, Dunger DB, Barnett AH, Todd JA. Insulin gene region-encoded susceptibility to type 1 diabetes is not restricted to HLA-DR4-positive individuals. Nat Genet 1992. 2:212-215. [DOD] [CrossRef]
- Bennett ST, Lucassen AM, Gough SC, Powell EE, Undlien DE, Pritchard LE, Merriman ME, Kawaguchi Y, Dronsfield MJ, Pociot F, Nerup J, Bouzekri N, Cambon-Thomsen A, Rønningen KS, Barnett AH, Bain SC, Todd JA. Susceptibility to human type 1 diabetes at IDDM2 is determined by tandem repeat variation at the insulin gene minisatellite locus. Nat Genet 1995. 9:284-292. [DOD] [CrossRef]
- Vafiadis P, Bennett ST, Todd JA, Nadeau J, Grabs R, Goodyer CG, Wickramasinghe S, Colle E, Polychronakos C. Insulin expression in human thymus is modulated by INS VNTR alleles at the IDDM2 locus. Nat Genet 1997. 15:289-292. [DOD] [CrossRef]
- Bottini N, Musumeci L, Alonso A, Rahmouni S, Nika K, Rostamkhani M, MacMurray J, Meloni GF, Lucarelli P, Pellecchia M, Eisenbarth GS, Comings D, Mustelin T. A functional variant of lymphoid tyrosine phosphatase is associated with type I diabetes. Nat Genet 2004. 36:337-338. [DOD] [CrossRef]
- Onengut-Gumuscu S, Ewens KG, Spielman RS, Concannon P. A functional polymorphism (1858C/T) in the PTPN22 gene is linked and associated with type I diabetes in multiplex families. Genes Immun 2004. 5:678-680. [DOD] [CrossRef]
- Smyth DJ, Cooper JD, Collins JE, Heward JM, Franklyn JA, Howson JMM, Walker N, Vella A, Nutland S, Rance HE, et al. Replication of an association between the lymphoid tyrosine phosphatase locus LYP/PTPN22 with type 1 diabetes, and evidence for its role as a general autoimmunity locus. Diabetes 2004. 53:3020-3023. [DOD] [CrossRef]
- Zheng W, She JX. Genetic association between a lymphoid tyrosine phosphatase (PTPN22) and type 1 diabetes. Diabetes 2005. 54:906-908. [DOD] [CrossRef]
- Steck AK, Baschal EE, Jasinski JM, Boehm BO, Bottini N, Concannon P, Julier C, Morahan G, Noble JA, Polychronakos C, She JX, Eisenbarth GS, Type I Diabetes Genetics Consortium. rs2476601 T allele (R620W) defines high-risk PTPN22 type I diabetes-associated haplotypes with preliminary evidence for an additional protective haplotype. Genes Immun 2009. 10:S21-S26. [DOD] [CrossRef]
- Steck AK, Rewers, MJ. Genetics of type 1 diabetes. Clin Chem 2011. 57:176-185. [DOD] [CrossRef]
- Vang T, Congia M, Macis MD, Musumeci L, Orru V, Zavattari P, Nika K, Tautz L, Tasken K, Cucca F, Mustelin T, Bottini N. Autoimmune-associated lymphoid tyrosine phosphatase is a gain-of-function variant. Nat Genet 2005. 37:1317-1319. [DOD] [CrossRef]
- Rieck M, Arechiga A, Onengut-Gumuscu S, Greenbaum C, Concannon P, Buckner JH. Genetic variation in PTPN22 corresponds to altered function of T and B lymphocytes. J Immunol 2007. 179:4704-4710. [DOD]
- Gyapay G, Morissette J, Vignal A, Dib C, Fizames C, Millasseau P, Marc S, Bernardi G, Lathrop M, Weissenbach J. The 1993-94 Genethon human genetic linkage map. Nat Genet 1994. 7:246-339. [DOD] [CrossRef]
- Dietrich WF, Katz H, Lincoln SE, Shin HS, Friedman J, Dracopoli NC, Lander ES. A genetic map of the mouse suitable for typing intraspecific crosses. Genetics 1992. 131:423-447. [DOD]
- Dietrich WF, Miller J, Steen R, Merchant MA, Demronboles D, Husain Z, Dredge R, Day MJ, Ingalls KA, O'Conner TJ. A comprehensive genetic map of the mouse genome. Nature 1996. 14:149-152. [DOD] [CrossRef]
- Tsang S, Sun Z, Luke B, Stevart C, Lum N, Gregory M, Wu X, Subleski M, Jenkins NA, Copeland NG, Munroe DJ. A comprehensive SNP-based genetic analysis of inbred mouse strains. Mamm Genome 2005. 16(7):476-480. [DOD] [CrossRef]
- Davies JL, Kawaguchi Y, Bennett ST, Copeman JB, Cordell HJ, Pritchard LE, Reed PW, Gough SC, Jenkins SC, Palmer SM, Balfour KM, Row B, Farrall M, Barnett AH, Bain SC, Todd JA. A genome-wide search for human type 1 diabetes susceptibility genes. Nature 1994. 371:130-136. [DOD] [CrossRef]
- Hashimoto L, Habita C, Beressi J, Delepine M, Besse C, Cambon-Thomsen A, Deschamps I, Rotter J, Djoulah S, James M, Froguel P, Weissenbach J, Lathrop GM, Julier C. Genetic mapping of a susceptibility locus for insulin-dependent diabetes mellitus on chromosome 11q. Nature 1994. 371:161-164. [DOD] [CrossRef]
- Lander E, Kruglyak L. Genetic dissection of complex traits: guidelines for interpreting and reporting linkage results. Nat Genet 1995. 11:241-247. [DOD] [CrossRef]
- Luo DF, Buzzetti R, Rotter JI, Maclaren NK, Raffel LJ, Nistico L, Giovannini C, Pozzilli P, Thomson G, She JX. Confirmation of three susceptibility genes to insulin-dependent diabetes mellitus: IDDM4, IDDM5 and IDDM8. Hum Mol Genet 1996. 5:693-698. [DOD] [CrossRef]
- Concannon P, Gogolin-Ewens KJ, Hinds DA, Wapelhorst B, Morrison VA, Stirling B, Mitra M, Farmer J, Williams SR, Cox NJ, Bell GI, Risch N, Spielman RS. A second-generation screen of the human genome for susceptibility to insulin-dependent diabetes mellitus. Nat Genet 1998. 19:292-296. [DOD] [CrossRef]
- Field LL, Tobias R, Magnus T. A locus on chromosome 15q26 (IDDM3) produces susceptibility to insulin-dependent diabetes mellitus. Nat Genet 1994. 8:189-194. [DOD] [CrossRef]
- Dizier MH, Babron MC, Clerget-Darpoux F. Interactive effect of two candidate genes in a disease: extension of the marker-association-segregation chi(2) method. Am J Hum Genet 1994. 55:1042-1049. [DOD]
- Cordell HJ, Todd JA, Bennett ST, Kawaguchi Y, Farrall M. Two-locus maximum lod score analysis of a multifactorial trait: joint consideration of IDDM2 and IDDM4 with IDDM1 in type 1 diabetes. Am J Hum Genet 1995. 57:920-934. [DOD]
- Bohren KM, Nadkarni V, Song JH, Gabbay KH, Owerbach D. A M55V polymorphism in a novel SUMO gene (SUMO-4) differentially activates heat shock transcription factors and is associated with susceptibility to type I diabetes mellitus. J Biol Chem 2004. 279:27233-27238. [DOD] [CrossRef]
- Guo D, Li M, Zhang Y, Yang P, Eckenrode S, Hopkins D, Zheng W, Purohit S, Podolsky RH, Muir A, et al. A functional variant of SUMO4, a new I kappa B alpha modifier, is associated with type 1 diabetes. Nat Genet 2004. 36:837-841. [DOD] [CrossRef]
- Smyth DJ, Howson JM, Lowe CE, Walker NM, Lam AC, Nutland S, Hutchings J, Tuomilehto-Wolf E, Tuomilehto J, Guja C, Ionescu-Tîrgoviste C, Undlien DE, Ronningen KS, Savage D, Dunger DB, Twells RC, McArdle WL, Strachan DP, Todd JA. Assessing the validity of the association between the SUMO4 M55V variant and risk of type 1 diabetes. Nat Genet 2005. 37:110-111. [DOD] [CrossRef]
- Park Y, Park S, Kang J, Yang S, Kim D. Assessing the validity of the association between the SUMO4 M55V variant and risk of type 1 diabetes. Nat Genet 2005. 37:112. [DOD] [CrossRef]
- Song GG, Choi SJ, Ji JD, Lee YH. Association between the SUMO4 M55V (A163G) polymorphism and susceptibility to type 1 diabetes: a meta-analysis. Hum Immunol 2012. In press. [DOD]
- Owerbach D, Gabbay KH. The HOXD8 locus (2q31) is linked to type I diabetes. Interaction with chromosome 6 and 11 disease susceptibility genes. Diabetes 1995. 44:132-136. [DOD] [CrossRef]
- Cornall RJ, Prins JB, Todd JA, Pressey A, DeLarato NH, Wicker LS, Peterson LB. Type 1 diabetes in mice is linked to the interleukin-1 receptor and Lsh/Ity/Bcg genes on chromosome 1. Nature 1991. 353:262-265. [DOD] [CrossRef]
- Walunas TL, Lenschow DJ, Bakker CY, Linsley PS, Freeman GJ, Green JM, Thompson CB, Bluestone JA. CTLA-4 can function as a negative regulator of T cell activation. Immunity 1994. 1:405-413. [DOD] [CrossRef]
- Nistico L, Buzzetti R, Pritchard LE, Van der Auwera B, Giovannini C, Bosi E, Larrad MT, Rios MS, Chow CC, Cockram CS, Jacobs K, Mijovic C, Bain SC, Barnett AH, Vandewalle CL, Schuit F, Gorus FK, Tosi R, Pozzilli P, Todd JA. The CTLA-4 gene region of chromosome 2q33 is linked to, and associated with, type 1 diabetes. Hum Mol Genet 1996. 5:1075-1080. [DOD] [CrossRef]
- Marron MP, Raffel LJ, Garchon HJ, Jacob CO, Serrano-Rios M, Martinez Larrad MT, Teng WP, Park Y, Zhang ZX, Goldstein DR, Tao YW, Beaurain G, Bach JF, Huang HS, Luo DF, Zeidler A, Rotter JI, Yang MC, Modilevsky T, Maclaren NK, She JX. Insulin-dependent diabetes mellitus (IDDM) is associated with CTLA4 polymorphisms in multiple ethnic groups. Hum Mol Genet 1997. 6:1275-1282. [DOD] [CrossRef]
- Kavvoura FK, Ioannidis JP. CTLA-4 gene polymorphisms and susceptibility to type 1 diabetes mellitus: a HuGE Review and meta-analysis. Am J Epidemiol 2005. 162:3-16. [DOD] [CrossRef]
- Ueda H, Howson JM, Esposito L, Heward J, Snook H, Chamberlain G, Rainbow DB, Hunter KM, Smith AN, Di Genova G, et al. Association of the T-cell regulatory gene CTLA4 with susceptibility to autoimmune disease. Nature 2003. 423:506-511. [DOD] [CrossRef]
- Oaks MK, Hallett KM, Penwell RT, Stauber EC, Warren SJ, Tector AJ. A native soluble form of CTLA-4. Cell Immunol 2000. 201:144-153. [DOD] [CrossRef]
- Vijayakrishnan L, Slavik JM, Illes Z, Greenwald RJ, Rainbow D, Greve B, Peterson LB, Hafler DA, Freeman GJ, Sharpe AH, Wicker LS, Kuchroo VK. An autoimmune disease-associated CTLA-4 splice variant lacking the B7 binding domain signals negatively in T cells. Immunity 2004. 20:563-575. [DOD] [CrossRef]
- Araki M, Chung D, Liu S, Rainbow DB, Chamberlain G, Garner V, Hunter KM, Vijayakrishnan L, Peterson LB, Oukka M, Sharpe AH, Sobel R, Kuchroo VK, Wicker LS. Genetic evidence that the differential expression of the ligand-independent isoform of CTLA-4 is the molecular basis of the Idd5.1 type 1 diabetes region in nonobese diabetic mice. J Immunol 2009. 183:5146-5157. [DOD] [CrossRef]
- Manzotti CN, Tipping H, Perry LC, Mead KI, Blair PJ, Zheng Y, Sansom DM. Inhibition of human T cell proliferation by CTLA-4 utilizes CD80 and requires CD25+ regulatory T cells. Eur J Immunol 2002. 32:2888-2896. [DOD] [CrossRef]
- Vandenborre K, Van Gool SW, Kasran A, Ceuppens JL, Boogaerts MA, Vandenberghe P. Interaction of CTLA-4 (CD152) with CD80 or CD86 inhibits human T-cell activation. Immunology 1999. 98:413-421. [DOD] [CrossRef]
- Gerold KD, Zheng P, Rainbow DB, Zernecke A, Wicker LS, Kissler S. The soluble CTLA-4 splice variant protects from type 1 diabetes and potentiates regulatory T-cell function. Diabetes 2011. 60:1955-1963. [DOD] [CrossRef]
- Todd JA. Genetic analysis of type 1 diabetes using whole genome approaches. Proc Natl Acad Sci U S A 1995. 92:8560-8565. [DOD] [CrossRef]
- Wapelhorst B, Bell GI, Risch N, Spielman RS, Concannon P. Linkage and association studies in insulin-dependent diabetes with a new dinucleotide repeat polymorphism at the GAD65 locus. Autoimmunity 1995. 21:127-130. [DOD] [CrossRef]
- Vella A, Cooper JD, Lowe CE, Walker N, Nutland S, Widmer B, Jones R, Ring SM, McArdle W, Pembrey ME, Strachan DP, Dunger DB, Twells RC, Clayton DG, Todd JA. Localization of a type 1 diabetes locus in the IL2RA/CD25 region by use of tag single-nucleotide polymorphisms. Am J Hum Genet 2005. 76:773-779. [DOD] [CrossRef]
- Malek TR, Bayer AL. Tolerance, not immunity, crucially depends on IL-2. Nat Rev Immunol 2004. 4:665-674. [DOD] [CrossRef]
- Lowe CE, Cooper JD, Brusko T, Walker NM, Smyth DJ, Bailey R, Bourget K, Plagnol V, Field S, Atkinson M, Clayton DG, Wicker LS, Todd JA. Large-scale genetic fine mapping and genotype-phenotype associations implicate polymorphism in the IL2RA region in type 1 diabetes. Nat Genet 2007. 39:1074-1082. [DOD] [CrossRef]
- Maier LM, Lowe CE, Cooper J, Downes K, Anderson DE, Severson C, Clark PM, Healy B, Walker N, Aubin C, Oksenberg JR, Hauser SL, Compston A, Sawcer S, International Multiple Sclerosis Genetics Consortium, De Jager PL, Wicker LS, Todd JA, Hafler DA. IL2RA genetic heterogeneity in multiple sclerosis and type 1 diabetes susceptibility and soluble interleukin-2 receptor production. Plos Genet 2009. 5:e1000322. [DOD] [CrossRef]
- Dendrou CA, Plagnol V, Fung E, Yang JH, Downes K, Cooper JD, Nutland S, Coleman G, Himsworth M, Hardy M, et al. Cell-specific protein phenotypes for the autoimmune locus IL2RA using a genotype-selectable human bioresource. Nat Genet 2009. 41:1011-1015. [DOD] [CrossRef]
- Merriman T, Twells R, Merriman M, Eaves I, Cox R, Cucca F, McKinney P, Shield J, Baum D, Bosi E, Pozzilli P, Nistico L, Buzzetti R, Joner G, Ronningen KS, Thorsby E, Undlien D, Pociot F, Nerup J, Bain S, Barnett A, Todd J. Evidence by allelic association-dependent methods for a type 1 diabetes polygene (IDDM6) on chromosome 18q21. Hum Mol Genet 1997. 6:1003-1010. [DOD] [CrossRef]
- Luo DF, Bui MM, Muir A, Maclaren NK, Thomson G, She JX. Affected-sib-pair mapping of a novel susceptibility gene to insulin-dependent diabetes mellitus (IDDM8) on chromosome 6q25-q27. Am J Hum Genet 1995. 57:911-919. [DOD]
- Mein CA, Esposito L, Dunn MG, Johnson GC, Timms AE, Goy JV, Smith AN, Sebag-Montefiore L, Merriman ME, Wilson AJ, Pritchard LE, Cucca F, Barnett AH, Bain SC, Todd JA. A search for type 1 diabetes susceptibility genes in families from the United Kingdom. Nat Genet 1998. 19:297-300. [DOD] [CrossRef]
- Paterson AD, Rahman P, Petronis A. IDDM9 and a locus for rheumatoid arthritis on chromosome 3q appear to be distinct. Hum Immunol 1999. 60:883-885. [DOD] [CrossRef]
- Field LL, Tobias R, Thomson G, Plon S. Susceptibility to insulin-dependent diabetes mellitus maps to a locus (IDDM11) on human chromosome 14q24.3-q31. Genomics 1996. 33(1):1-8. [DOD] [CrossRef]
- Morahan G, Huang D, Tait BD, Colman PG, Harrison LC. Markers on distal chromosome 2q linked to insulin-dependent diabetes mellitus. Science 1996. 272:1811-1813. [DOD] [CrossRef]
- Delepine M, Pociot F, Habita C, Hashimoto L, Froguel P, Rotter J, Cambon-Thomsen A, Deschamps I, Djoulah S, Weissenbach J, Nerup J, Lathrop M, Julier C. Evidence of a non-MHC susceptibility locus in type I diabetes linked to HLA on chromosome 6. Am J Hum Genet 1997. 60:174-187. [DOD]
- Concannon P, Erlich HE, Julier C, Morahan G, Nerup J, Pociot F, Todd JA, Rich SS, Type 1 Diabetes Genetics Consortium. Type 1 diabetes: evidence for susceptibility loci from four genome-wide linkage scans in 1435 multiplex families. Diabetes 2005. 54:2995-3001. [DOD] [CrossRef]
- Concannon P, Chen WM, Julier C, Morahan G, Akolkar B, Erlich HA, Hilner JE, Nerup J, Nierras C, Pociot F, Todd JA, Rich SS, Type 1 Diabetes Genetics Consortium. Genome-wide scan for linkage to type 1 diabetes in 2,496 multiplex families from the Type 1 Diabetes Genetics Consortium. Diabetes 2009. 58:1018-1022. [DOD] [CrossRef]
- Todd JA, Farrall M. Panning for gold: genome-wide scanning for linkage in type 1 diabetes. Hum Mol Genet 1996. 5:1443-1448. [DOD]
- Cardon LR, Bell JI. Association study designs for complex diseases. Nat Rev Genet 2001. 2:91-99. [DOD] [CrossRef]
- Wang WY, Barratt BJ, Clayton DG, Todd JA. Genome-wide association studies: theoretical and practical concerns. Nat Rev Genet 2005. 6:109-118. [DOD] [CrossRef]
- Kruglyak L. Prospects for whole-genome linkage disequilibrium mapping of common disease genes. Nat Genet 1999. 22:139-144. [DOD] [CrossRef]
- Smyth DJ, Cooper JD, Bailey R, Field S, Burren O, Smink LJ, Guja C, Ionescu-Tirgoviste C, Widmer B, Dunger DB, Savage DA, Walker NM, Clayton DG, Todd JA. A genome-wide association study of nonsynonymous SNPs identifies a type 1 diabetes locus in the interferon-induced helicase (IFIH1) region. Nat Genet 2006. 38:617-619. [DOD] [CrossRef]
- Weiss KM, Terwilliger JD. How many diseases does it take to map a gene with SNPs? Nat Genet 2000. 26:151-157. [DOD]
- Liu S, Wang H, Jin Y, Podolsky R, Reddy MV, Pedersen J, Bode B, Reed J, Steed D, Anderson S, Yang P, Muir A, Steed L, Hopkins D, Huang Y, Purohit S, Wang CY, Steck AK, Montemari A, Eisenbarth G, Rewers M, She JX. IFIH1 polymorphisms are significantly associated with type 1 diabetes and IFIH1 gene expression in peripheral blood mononuclear cells. Hum Mol Genet 2009. 18:358-365. [DOD] [CrossRef]
- Wellcome Trust Case Control Consortium, Australo-Anglo-American Spondylitis Consortium (TASC), Burton PR, Clayton DG, Cardon LR, Craddock N, Deloukas P, Duncanson A, Kwiatkowski DP, McCarthy MI, et al. Association scan of 14,500 nonsynonymous SNPs in four common diseases identifies variants involved in autoimmunity. Nat Genet 2007. 39:1329-1337. [DOD] [CrossRef]
- Todd JA, Walker NM, Cooper JD, Smyth DJ, Downes K, Plagnol V, Bailey R, Nejentsev S, Field SF, Payne F, et al. Robust associations of four new chromosome regions from genome-wide analyses of type 1 diabetes. Nat Genet 2007. 39:857-864. [DOD] [CrossRef]
- Wang H, Jin Y, Reddy MV, Podolsky R, Liu S, Yang P, Bode B, Reed JC, Steed RD, Anderson SW, Steed L, Hopkins D, Huang Y, She JX. Genetically dependent ERBB3 expression modulates antigen presenting cell function and type 1 diabetes risk. Plos One 2010. 5:e11789. [DOD] [CrossRef]
- Hakonarson H, Qu HQ, Bradfield JP, Marchand L, Kim CE, Glessner JT, Grabs R, Casalunovo T, Taback SP, Frackelton EC, et al. A novel susceptibility locus for type 1 diabetes on Chr12q13 identified by a genome-wide association study. Diabetes 2008. 57:1143-1146. [DOD] [CrossRef]
- Hakonarson H, Grant SF, Bradfield JP, Marchand L, Kim CE, Glessner JT, Grabs R, Casalunovo T, Taback SP, Frackelton EC, et al. A genome-wide association study identifies KIAA0350 as a type 1 diabetes gene. Nature 2007. 448:591-594. [DOD] [CrossRef]
- Bottino C, Castriconi R, Pende D, Rivera P, Nanni M, Carnemolla B, Cantoni C, Grassi J, Marcenaro S, Reymond N, Vitale M, Moretta L, Lopez M, Moretta A. Identification of PVR (CD155) and Nectin-2 (CD112) as cell surface ligands for the human DNAM-1 (CD226) activating molecule. J Exp Med 2003. 198:557-567. [DOD] [CrossRef]
- Pende D, Bottino C, Castriconi R, Cantoni C, Marcenaro S, Rivera P, Spaggiari GM, Dondero A, Carnemolla B, Reymond N, Mingari MC, Lopez M, Moretta L, Moretta A. PVR (CD155) and Nectin-2 (CD112) as ligands of the human DNAM-1 (CD226) activating receptor: involvement in tumor cell lysis. Mol Immunol 2005. 42:463-469. [DOD] [CrossRef]
- Dardalhon V, Schubart AS, Reddy J, Meyers JH, Monney L, Sabatos CA, Ahuja R, Nguyen K, Freeman GJ, Greenfield EA, Sobel RA, Kuchroo VK. CD226 is specifically expressed on the surface of Th1 cells and regulates their expansion and effector functions. J Immunol 2005. 175:1558-1565. [DOD]
- Gilfillan S, Chan CJ, Cella M, Haynes NM, Rapaport AS, Boles KS, Andrews DM, Smyth MJ, Colonna M. DNAM-1 promotes activation of cytotoxic lymphocytes by nonprofessional antigen-presenting cells and tumors. J Exp Med 2008. 205:2965-2973. [DOD] [CrossRef]
- Cooper JD, Smyth DJ, Smiles AM, Plagnol V, Walker NM, Allen JE, Downes K, Barrett JC, Healy BC, Mychaleckyj JC, Warram JH, Todd JA. Meta-analysis of genome-wide association study data identifies additional type 1 diabetes risk loci. Nat Genet 2008. 40:1399-1401. [DOD] [CrossRef]
- Denny P, Lord CJ, Hill NJ, Goy JV, Levy ER, Podolin PL, Peterson LB, Wicker LS, Todd JA, Lyons PA. Mapping of the IDDM locus Idd3 to a 0.35-cM interval containing the interleukin-2 gene. Diabetes 1997. 46:695-700. [DOD] [CrossRef]
- Hong SW, Kim S, Lee DK. The role of Bach2 in nucleic acid-triggered antiviral innate immune responses. Biochem Biophys Res Commun 2008. 365:426-432. [DOD] [CrossRef]
- Barrett JC, Clayton DG, Concannon P, Akolkar B, Cooper JD, Erlich HA, Julier C, Morahan G, Nerup J, Nierras C, Plagnol V, Pociot F, Schuilenburg H, Smyth DJ, Stevens H, Todd JA, Walker NM, Rich SS, Type 1 Diabetes Genetics Consortium. Genome-wide association study and meta-analysis find that over 40 loci affect risk of type 1 diabetes. Nat Genet 2009. 41:703-707. [DOD] [CrossRef]
- Moore KW, de Waal Malefyt R, Coffman RL, O'Garra A. Interleukin-10 and the interleukin-10 receptor. Annu Rev Immunol 2001. 19:683-765. [DOD] [CrossRef]
- Vazquez BN, Laguna T, Notario L, Lauzurica P. Evidence for an intronic cis-regulatory element within CD69 gene. Genes Immun 2012. 13:356-362. [DOD] [CrossRef]
- Bankovich AJ, Shiow LR, Cyster JG. CD69 Suppresses Sphingosine 1-Phosophate Receptor-1 (S1P1) Function through Interaction with Membrane Helix 4. J Biol Chem 2010. 285:22328-22337. [DOD] [CrossRef]
- Maki T, Gottschalk R, Monaco AP. Prevention of autoimmune diabetes by FTY720 in nonobese diabetic mice. Transplantation 2002. 74:1684-1686. [DOD] [CrossRef]
- Yang Z, Chen M, Fialkow LB, Ellett JD, Wu R, Brinkmann V, Nadler JL, Lynch KR. The immune modulator FYT720 prevents autoimmune diabetes in nonobese diabetic mice. Clin Immunol 2003. 107:30-35. [DOD] [CrossRef]
- So HC, Gui AH, Cherny SS, Sham PC. Evaluating the heritability explained by known susceptibility variants: a survey of ten complex diseases. Genet Epidemiol 2011. 35:310-317. [DOD] [CrossRef]
- Manolio TA, Collins FS, Cox NJ, Goldstein DB, Hindorff LA, Hunter DJ, McCarthy MI, Ramos EM, Cardon LR, Chakravarti A, et al. Finding the missing heritability of complex diseases. Nature 2009. 461:747-753. [DOD] [CrossRef]
- Maher B. Personal genomes: the case of the missing heritability. Nature 2008. 456:18-21. [DOD] [CrossRef]
- Vineis P, E Pearce N. Genome-wide association studies may be misinterpreted: genes versus heritability. Carcinogenesis 2011. 32:1295-1298. [DOD] [CrossRef]
- Beebe GW, Kurtzke JF, Kurland LT, Auth TL, Nagler B. Studies on the natural history of multiple sclerosis. 3. Epidemiologic analysis of the army experience in World War II. Neurology 1967. 17:1-17. [DOD] [CrossRef]
- Miller H, Ridley A, Schapira K. Multiple sclerosis. A note on social incidence. Br Med J 1960. 2:343-345. [DOD] [CrossRef]
- Patterson CC, Waugh NR. Urban/rural and deprivational differences in incidence and clustering of childhood diabetes in Scotland. Int J Epidemiol 1992. 21:108-117. [DOD] [CrossRef]
- Walsh SJ, DeChello LM. Geographical variation in mortality from systemic lupus erythematosus in the United States. Lupus 2001. 10:637-646. [DOD] [CrossRef]
- Munger KL, Zhang SM, O'Reilly E, Hernan MA, Olek MJ, Willett WC, Ascherio A. Vitamin D intake and incidence of multiple sclerosis. Neurology 2004. 62:60-65. [DOD] [CrossRef]
- Dahl-Jorgensen K, Joner G, Hanssen KF. Relationship between cows' milk consumption and incidence of IDDM in childhood. Diabetes Care 1991. 14:1081-1083. [DOD] [CrossRef]
- Falconer DS. The inheritance of liability to certain diseases, estimated from the incidence among relatives. Ann Hum Genet Lond 1965. 29:51-76. [DOD] [CrossRef]
- Falconer DS. The inheritance of liability to diseases with variable age of onset, with particular reference to diabetes mellitus. Ann Hum Genet Lond 1967. 31:1-20. [DOD]
- Baxter AG. Modelling the effects of genetic and environmental factors on the risk of autoimmune disease. J Autoimmun 2001. 16:31-35. [DOD] [CrossRef]
- Becker T, Herold C, Meesters C, Mattheisen M, Baur MP. Significance levels in genome-wide interaction analysis (GWIA). Ann Hum Genet 2011. 75:29-35. [DOD] [CrossRef]
- Laird PW. Principles and challenges of genomewide DNA methylation analysis. Nat Rev Genet 2010. 11:191-203. [DOD] [CrossRef]
- Slatkin M. Epigenetic inheritance and the missing heritability problem. Genetics 2009. 182:845-850. [DOD] [CrossRef]
- Iafrate AJ, Feuk L, Rivera MN, Listewnik ML, Donahoe PK, Qi Y, Scherer SW, Lee C. Detection of large-scale variation in the human genome. Nat Genet 2004. 36:949-951. [DOD] [CrossRef]
- Lupski JR, Wise CA, Kuwano A, Pentao L, Parke JT, Glaze DG, Ledbetter DH, Greenberg F, Patel PI. Gene dosage is a mechanism for Charcot-Marie-Tooth disease type 1A. Nat Genet 1992. 1:29-33. [DOD] [CrossRef]
- Chance PF, Alderson MK, Leppig KA, Lensch MW, Matsunami N, Smith B, Swanson PD, Odelberg SJ, Disteche CM, Bird TD. DNA deletion associated with hereditary neuropathy with liability to pressure palsies. Cell 1993. 72:143-151. [DOD] [CrossRef]
- Wellcome Trust Case Control Consortium, Craddock N, Hurles ME, Cardin N, Pearson RD, Plagnol V, Robson S, Vukcevic D, Barnes C, Conrad DF, et al. Genome-wide association study of CNVs in 16,000 cases of eight common diseases and 3,000 shared controls. Nature 2010. 464:713-720. [DOD] [CrossRef]
- Grayson BL, Smith ME, Thomas JW, Wang L, Dexheimer P, Jeffrey J, Fain PR, Nanduri P, Eisenbarth GS, Aune TM. Genome-wide analysis of copy number variation in type 1 diabetes. Plos One 2010. 5(11):e15393. [DOD] [CrossRef]
- Daly M, Rioux JD, Schaffner DF, Hudson TJ, Lander ES. High-resolution haplotype structure in the human genome. Nature Genet 2001. 29:229-232. [DOD] [CrossRef]
- Jeffreys AJ, Kauppi L, Neumann R. Intensely punctuate meiotic recombination in the class II region of the major histocompatibility complex. Nature Genet 2001. 29:217-222. [DOD] [CrossRef]
- Zhang K, Calabrese P, Nordborg M, Sun F. Haplotype block structure and its applications to association studies: power and study designs. Am J Hum Genet 2002. 71:1386-1394. [DOD] [CrossRef]
- Spencer C, Hechter E, Vukcevic D, Donnelly P. Quantifying the Underestimation of Relative Risks from Genome-Wide Association Studies. Plos Genet 2011. 7(3):e1001337. [DOD] [CrossRef]
- Tomlinson IP, Carvajal-Carmona LG, Dobbins SE, Tenesa A, Jones AM, Howarth K, Palles C, Broderick P, Jaeger EE, Farrington S, et al. Multiple common susceptibility variants near BMP pathway loci GREM1, BMP4, and BMP2 explain part of the missing heritability of colorectal cancer. Plos Genet 2011. 7(6):e1002105. [DOD] [CrossRef]
- Ehret GB, Lamparter D, Hoggart CJ, Genetic Investigation of Anthropometric Traits Consortium, Whittaker JC, Beckmann JS, Kutalik Z. A Multi-SNP Locus-Association Method Reveals a Substantial Fraction of the Missing Heritability. Am J Hum Genet 2012. 91:863-871. [DOD] [CrossRef]
- Park JH, Wacholder S, Gail MH, Peters U, Jacobs KB, Chanock SJ, Chatterjee N. Estimation of effect size distribution from genome-wide association studies and implications for future discoveries. Nat Genet 2010. 42:570-575. [DOD] [CrossRef]
- Nakagawa Y, Kawaguchi Y, Twells RC, Muxworthy C, Hunter KM, Wilson A, Merriman ME, Cox RD, Merriman T, Cucca F, et al. Fine mapping of the diabetes-susceptibility locus, IDDM4, on chromosome 11q13. Am J Hum Genet 1998. 63:547-556. [DOD] [CrossRef]
- Eckenrode S, Marron MP, Nicholls R, Yang MC, Yang JJ, Guida Fonseca LC, She JX. Fine-mapping of the type 1 diabetes locus (IDDM4) on chromosome 11q and evaluation of two candidate genes (FADD and GALN) by affected sibpair and linkage-disequilibrium analyses. Hum Genet 2000. 106:14-18. [DOD] [CrossRef]
- Twells RC, Mein CA, Payne F, Veijola R, Gilbey M, Bright M, Timms A, Nakagawa Y, Snook H, Nutland S, Rance HE, Carr P, Dudbridge F, Cordell HJ, Cooper J, Tuomilehto-Wolf E, Tuomilehto J, Phillips M, Metzker M, Hess JF, Todd JA. Linkage and association mapping of the LRP5 locus on chromosome 11q13 in type 1 diabetes. Hum Genet 2003. 113:99-105. [DOD]
- Wang F, Fang Q, Ge Z, Yu N, Xu S, Fan X. Common BRCA1 and BRCA2 mutations in breast cancer families: a meta-analysis from systematic review. Mol Biol Rep 2012. 39:2109-2118. [DOD] [CrossRef]
- Ashburner M, Ball CA, Blake JA, Botstein D, Butler H, Cherry JM, Davis AP, Dolinski K, Dwight SS, Eppig JT, Harris MA, Hill DP, Issel-Tarver L, Kasarskis A, Lewis S, Matese JC, Richardson JE, Ringwald M, Rubin GM, Sherlock G. Gene ontology: tool for the unification of biology. The Gene Ontology Consortium. Nat Genet 2000. 25:25-29. [DOD] [CrossRef]
- International Multiple Sclerosis Genetics Consortium, Wellcome Trust Case Control Consortium 2, Sawcer S, Hellenthal G, Pirinen M, Spencer CC, Patsopoulos NA, Moutsianas L, Dilthey A, Su Z, et al. Genetic risk and a primary role for cell-mediated immune mechanisms in multiple sclerosis. Nature 2011. 476:214-219. [DOD] [CrossRef]
- Kanehisa M, Araki M, Goto S, Hattori M, Hirakawa M, Itoh M, Katayama T, Kawashima S, Okuda S, Tokimatsu T, Yamanishi Y. KEGG for linking genomes to life and the environment. Nucleic Acids Res 2008. 36:D480-D484. [DOD] [CrossRef]
- Li C, Han J, Shang D, Li J, Wang Y, Wang Y, Zhang Y, Yao Q, Zhang C, Li K, Li X. Identifying disease related sub-pathways for analysis of genome-wide association studies. Gene 2012. 503:101-109. [DOD] [CrossRef]
- Kleinjan DA, van Heyningen V. Long-range control of gene expression: emerging mechanisms and disruption in disease. Am J Hum Genet 2005. 76:8-32. [DOD] [CrossRef]
- Alcina A, Abad-Grau Mdel M, Fedetz M, Izquierdo G, Lucas M, Fernandez O, Ndagire D, Catala-Rabasa A, Ruiz A, Gayan J, Delgado C, Arnal C, Matesanz F. Multiple sclerosis risk variant HLA-DRB1*1501 associates with high expression of DRB1 gene in different human populations. PLoS One 2012. 7:e29819. [DOD] [CrossRef]
- Ramagopalan SV, Maugeri NJ, Handunnetthi L, Lincoln MR, Orton SM, Dyment DA, Deluca GC, Herrera BM, Chao MJ, Sadovnick AD, Ebers GC, Knight JC. Expression of the multiple sclerosis-associated MHC class II Allele HLA-DRB1*1501 is regulated by vitamin D. PLoS Genet 2009. 5:e1000369. [DOD] [CrossRef]
- Jacob CO, Fronek Z, Lewis GD, Koo M, Hansen JA, McDevitt HO. Heritable major histocompatibility complex class II-associated differences in production of tumor necrosis factor alpha: relevance to genetic predisposition to systemic lupus erythematosus. Proc Natl Acad Sci U S A 1990. 87:1233-1237. [DOD] [CrossRef]
- Graham RR, Kozyrev SV, Baechler EC, Reddy MV, Plenge RM, Bauer JW, Ortmann WA, Koeuth T, Gonzalez Escribano MF, et al. A common haplotype of interferon regulatory factor 5 (IRF5) regulates splicing and expression and is associated with increased risk of systemic lupus erythematosus. Nat Genet 2006. 38:550-555. [DOD] [CrossRef]
- Maier LM, Anderson DE, Severson CA, Baecher-Allan C, Healy B, Liu DV, Wittrup KD, De Jager PL, Hafler DA. Soluble IL-2RA levels in multiple sclerosis subjects and the effect of soluble IL-2RA on immune responses. J Immunol 2009. 182:1541-1547. [DOD]
- De Jager PL, Jia X, Wang J, de Bakker PI, Ottoboni L, Aggarwal NT, Piccio L, Raychaudhuri S, Tran D, Aubin C, et al. Meta-analysis of genome scans and replication identify CD6, IRF8 and TNFRSF1A as new multiple sclerosis susceptibility loci. Nat Genet 2009. 41:776-782. [DOD] [CrossRef]
- Zuvich RL, Bush WS, Mccauley JL, Beecham AH, De Jager PL, Ivinson AJ, Compston A, Hafler DA, Hauser SL, Sawcer SJ, Pericak-Vance MA, Barcellos LF, Mortlock DP, Haines JL. Interrogating the complex role of chromosome 16p13.13 in multiple sclerosis susceptibility: independent genetic signals in the CIITA-CLEC16A-SOCS1 gene complex. Hum Mol Genet 2011. 20:3517-3524. [DOD] [CrossRef]
- Blanco-Kelly F, Matesanz F, Alcina A, Teruel M, Diaz-Gallo LM, Gomez-Garcia M, Lopez-Nevot MA, Rodrigo L, Nieto A, Cardena C, Alcain G, Diaz-Rubio M, De La Concha EG, Fernandez O, Arroyo R, Martin J, Urcelay E. CD40: novel association with Crohn's disease and replication in multiple sclerosis susceptibility. PLoS one 2010. 5:e11520. [DOD] [CrossRef]
- Göring HH, Curran JE, Johnson MP, Dyer TD, Charlesworth J, Cole SA, Jowett JB, Abraham LJ, Rainwater DL, Comuzzie AG, Mahaney MC, Almasy L, MacCluer JW, Kissebah AH, Collier GR, Moses EK, Blangero J. Discovery of expression QTLs using large-scale transcriptional profiling in human lymphocytes. Nat Genet 2007. 39:1208-1216. [DOD] [CrossRef]
- Veyrieras JB, Kudaravalli S, Kim SY, Dermitzakis ET, Gilad Y, Stephens M, Pritchard JK. High-resolution mapping of expression-QTLs yields insight into human gene regulation. Plos Genet 2008. 4(10):e1000214. [DOD] [CrossRef]
- Dimas AS, Deutsch S, Stranger BE, Montgomery SB, Borel C, Attar-Cohen H, Ingle C, Beazley C, Gutierrez Arcelus M, Sekowska M, Gagnebin M, Nisbett J, Deloukas P, Dermitzakis ET, Antonarakis SE. Common regulatory variation impacts gene expression in a cell type-dependent manner. Science 2009. 325:1246-1250. [DOD] [CrossRef]
- Rotival M, Zeller T, Wild PS, Maouche S, Szymczak S, Schillert A, Castagne R, Deiseroth A, Proust C, Brocheton J, et al. Integrating genome-wide genetic variations and monocyte expression data reveals trans-regulated gene modules in humans. PLoS Genet 2011. 7(12):e1002367. [DOD] [CrossRef]
- Hänninen A, Taylor C, Streeter PR, Stark LS, Sarte JM, Shizuru JA, Simell O, Michie SA. Vascular addressins are induced on islet vessels during insulitis in nonobese diabetic mice and are involved in lymphoid cell binding to islet endothelium. J Clin Invest 1993. 92:2509-2515. [DOD] [CrossRef]
- Hänninen A, Jaakkola I, Jalkanen S. Mucosal addressin is required for the development of diabetes in nonobese diabetic mice. J Immunol 1998. 160:6018-6025. [DOD]
- Phillips JM, Haskins K, Cooke A. MAdCAM-1 is needed for diabetes development mediated by the T cell clone, BDC-2.5. Immunology 2005. 116:525-531. [DOD]
- Smyth DJ, Plagnol V, Walker NM, Cooper JD, Downes K, Yang JH, Howson JM, Stevens H, McManus R, Wijmenga C, et al. Shared and distinct genetic variants in type 1 diabetes and celiac disease. N Engl J Med 2008. 359:2767-2777. [DOD] [CrossRef]
- Bradfield JP, Qu HQ, Wang K, Zhang H, Sleiman PM, Kim CE, Mentch FD, Qiu H, Glessner JT, Thomas KA, et al. A genome-wide meta-analysis of six type 1 diabetes cohorts identifies multiple associated loci. Plos Genet 2011. 7:e1002293. [DOD] [CrossRef]
- Fung EY, Smyth DJ, Howson JM, Cooper JD, Walker NM, Stevens H, Wicker LS, Todd JA. Analysis of 17 autoimmune disease-associated variants in type 1 diabetes identifies 6q23/TNFAIP3 as a susceptibility locus. Genes Immun 2009. 10:188-191. [DOD] [CrossRef]
- Swafford AD, Howson JM, Davison LJ, Wallace C, Smyth DJ, Schuilenburg H, Maisuria-Armer M, Mistry T, Lenardo MJ, Todd JA. An allele of IKZF1 (Ikaros) conferring susceptibility to childhood acute lymphoblastic leukemia protects against type 1 diabetes. Diabetes 2011. 60:1041-1044. [DOD] [CrossRef]
- Bailey R, Cooper JD, Zeitels L, Smyth DJ, Yang JH, Walker NM, Hypönen E, Dunger DB, Ramos-Lopez E, Badenhoop K, Nejentsev S, Todd JA. Association of the vitamin D metabolism gene CYP27B1 with type 1 diabetes. Diabetes 2007. 56:2616-2621. [DOD] [CrossRef]
This article has been cited by other articles:

|
Association between telomere length and diabetes mellitus: A meta-analysis
Wang J, Dong X, Cao L, Sun Y, Qiu Y, Zhang Y, Cao R, Covasa M, Zhong L
J Int Med Res 2016. 44(6):1156-1173
|
|

|
How Can We Explain Very Low Odds Ratios in GWAS? I. Polygenic Models
Hodge SE, Greenberg DA
Hum Hered 2016. 81(4):173-180
|
|

|
A Bioinformatics Approach to the Identification of Variants Associated with Type 1 and Type 2 Diabetes Mellitus that Reside in Functionally Validated miRNAs Binding Sites
Ghaedi H, Bastami M, Jahani MM, Alipoor B, Tabasinezhad M, Ghaderi O, Nariman-Saleh-Fam Z, Mirfakhraie R, Movafagh A, Omrani MD, Masotti A
Biochem Genet 2016. 54(3):211-221
|
|

|
Genetic variations in the PSMA3, PSMA6 and PSMC6 genes are associated with type 1 diabetes in Latvians and with expression level of number of UPS-related and T1DM-susceptible genes in HapMap individuals
Sjakste T, Paramonova N, Osina K, Dokane K, Sokolovska J, Sjakste N
Mol Genet Genomics 2016. 291(2):891-903
|
|
|


)
)
)