Original Data
| Rev Diabet Stud,
2008,
5(3):163-170 |
DOI 10.1900/RDS.2008.5.163 |
Effects of Gender and Height on the Oral Glucose Tolerance Test: The Isfahan Diabetes Prevention Study
Mohsen Janghorbani1, Massoud Amini2
1School of Public Health, Isfahan University of Medical Sciences, Isfahan, Iran
2Isfahan Endocrine and Metabolism Research Center, Isfahan University of Medical Sciences, Isfahan, Iran
Address correspondence to: Mohsen Janghorbani, e-mail: janghorbani@yahoo.com
Manuscript submitted September 18, 2008; resubmitted November 11, 2008; accepted November 28, 2008.
Keywords: type 2 diabetes, first-degree relatives, gender, height, glucose intolerance
Abstract
BACKGROUND: Impaired fasting glucose (IFG) is more prevalent in men, whereas impaired glucose tolerance (IGT) is more prevalent in women. AIM: To determine whether gender difference in the prevalence of glucose intolerance is related to height. METHODS: A cross-sectional study of 2,368 first-degree relatives (FDR) of patients with type 2 diabetes was conducted between years 2003 to 2005. All participants (614 men and 1754 women) were in the age range 30-60 years, and were FDR of consecutive patients from outpatient clinics at Isfahan Endocrine and Metabolism Research Centre, Iran. All subjects underwent a standard 75 g 2-h oral glucose tolerance test (OGTT). Weight, height, waist and hip circumference, and glycated haemoglobin were also measured. RESULTS: IGT was more common amongst women (OR 0.66; 95% CI 0.51, 0.87),whereas diabetes (OR 1.31; 95% CI 0.96, 1.78), and IFG (OR 1.41; 95% CI 1.10, 1.80) was more common amongst men. Women had a lower mean fasting plasma glucose (FPG) (p < 0.001), but showed higher 2hPG, and FPG-2hPG increase (p < 0.001). The gender difference in mean 2hPG and FPG-2hPG increase, was not evident after adjustment for height. Negative correlation to height was observed in 2hPG and FPG-2hPG increase, both in men and women (p < 0.001), but height showed little association with FPG. CONCLUSIONS: Women had higher mean 2hPG and FPG-2hPG increase, but showed a lower FPG level than men. The inverse association between height and 2hPG and FPG-2hPG increase may be explained by gender difference.
Introduction
Several studies found that impaired fasting glucose (IFG) is more prevalent in men, whilst impaired glucose tolerance (IGT) is more prevalent in women [1-5]. As yet, no clear explanation has been found for the pattern where women tend to have a higher 2-hour plasma glucose (2hPG) than men who have a higher fasting plasma glucose (FPG) value. Women are usually shorter than men, and shortness is associated with poorer glucose tolerance and gestational diabetes in diverse populations [6-13]. Currently, only one study has sought to explain the extent of gender difference in relation to glucose metabolism [14]. The study investigated the relationship between height and response to the oral glucose tolerance test (OGTT), postulating that the inverse relationship between height and 2hPG could be attributable to fixed glucose load in the OGTT, irrespective of body size. However, Sicree et al. referred to fixed glucose load as the main cause of gender difference in response to OGTT, and it is likely that genetic factors also influence gender difference in response to OGTT. Height [15, 16] and glucose metabolism risk factors [17-20] such as obesity are determined by genetic and early environmental influences. First-degree relatives (FDR) of patients with type 2 diabetes are genetically pre-disposed to a high risk of glucose intolerance and might be more appropriate for testing this hypothesis.
The objective of this study was to fill in some of these knowledge gaps by determining gender differences in response to OGTT, and to discover whether body structure differences may explain these gender differences amongst FDR of patients with type 2 diabetes.
Subjects and methods
The recruitment methods and examination procedures of the Isfahan Diabetes Prevention Study (IDPS) have been described before [3]. Briefly, the IDPS is an ongoing cohort study in central Iran to assess the efficacy of intensive diet and exercise to prevent or delay the onset of type 2 diabetes mellitus in FDR of patients with type 2 diabetes. Our study sample comprised 2,368 (614 men and 1754 women) FDR of consecutive patients with type 2 diabetes. All patients were attendees at clinics in Isfahan Endocrine and Metabolism Research Center, which is affiliated to Isfahan University of Medical Sciences, Iran. The participants included siblings and children. The study was conducted between years 2003 and 2005.
Participants, reported to clinics in the morning after an overnight fast. Subjects were asked to abstain from vigorous exercise in the evening before, and in the morning of the investigations. Smokers were encouraged to abstain from smoking in the morning of the investigations. First, on arrival at the clinic, the information given by the participants in the questionnaire on family history was verified. Then, with the subjects in light clothes and without shoes, height, weight, waist and hip circumference were measured using standard apparatus. Weight was measured to the nearest 0.1 kg on a calibrated beam scale. Height, waist and hip circumference were measured to the nearest 0.5 cm with a measuring tape. Waist was measured midway between the lower rib margin and the iliac-crest at the end of a gentle expiration. Hip circumference was measured over the greater trochanters directly over the underwear.
Body mass index (BMI) (kg/m2) is recognized as the measure of overall obesity. Normal BMI was defined as BMI < 25, overweight as BMI 25-29.99, and obesity as BMI ≥ 30. Waist circumference (WC) was used as a measure of abdominal obesity, defined as WC ≥ 102 cm in men and ≥88 cm in women. A waist-to-hip ratio (WHR) of <0.8 in women and <0.95 in men was considered normal. WC was used as an integrated measure of obesity and fat distribution. This was based on studies suggesting that WC is more highly correlated with both total and abdominal body fat when measured by computed tomography or magnetic resonance imaging, rather than WHR [21, 22]. Participants were classified into quartiles of height, with cut-points of 165.2, 169.7 and 173.9 cm for men, and 152.5, 155.8 and 159.5 cm for women. Pregnant women and known diabetic individuals were excluded.
Tenets of the Declaration of Helsinki were followed, institutional ethical committee approval was granted, and an informed consent form was signed by each participant.
Classification of glucose tolerance
Subjects underwent a standard oral glucose tolerance test (OGTT (75 g glucose 2h)) according to the American Diabetes Association (ADA) criteria [23]. Venous blood was sampled 0, 30, 60, and 120 min. after oral glucose administration. Plasma samples were centrifuged and analyzed the same day. FPG ≥ 126 mg/dl or 2hPG of ≥ 200 mg/dl defined diabetes mellitus. IGT was defined as FPG < 126 mg/dl, but with 2hPG concentration ≥140 and <200 mg/dl. If FPG was in the range of 100 to 126 mg/dl and 2hPG was <140 mg/dl, it was considered as IFG. Whereas, if FPG was below 100 mg/dl and 2hPG smaller than 140 mg/dl, it was considered a sign of normal glucose tolerance [23, 24]. The FPG-2hPG increase was calculated as 2hPG minus FPG. Glycosylated hemoglobin (HbA1c) was also assessed, as measured by ion-exchange chromatography.
Statistical analysis
Statistical methods included the Student's t-test, chi squared test, and multivariate regression (linear and logistic). All analyses were stratified by gender. Adjusted means were calculated and compared using general linear models. All analyses were performed with the SPSS for Windows (SPSS Inc., Chicago, IL, USA). All tests for statistical significance were two-tailed, and performed assuming a type I error probability of <0.05.
Results
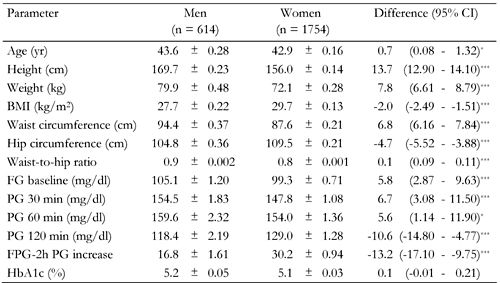
Differences in the distribution of characteristics amongst the 2,368 participants (614 men and 1754 women) are shown in Table 1. Women were younger than men, and had lower mean waist circumference, height and weight, WHR, FPG, 30 and 60 minutes PG.. Men had lower BMI, hip circumference, 2hPG and FPG-2hPG increase, than women. The mean (standard deviation (SD)) age of men was 43.6 (6.9) years, and for women 42.9 (6.7) years. Men and women had similar HbA1c levels.
Table
1.
Clinical characteristics of first-degree relatives of type 2 diabetes patients |
|
 |
 |
Legend:
Data are age-adjusted means ± standard error of selected characteristics among 614 men and 1754 women. Age-adjusted means were calculated using general linear model. FG: fasting glucose. PG: plasma glucose. FPG: fasting plasma glucose. BMI: body mass index. * p < 0.05. ** p < 0.01, *** p < 0.001. |
|
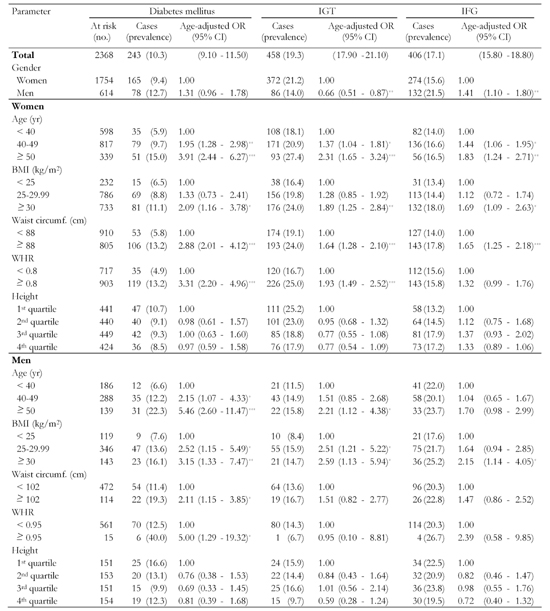
Out of the 2,368 participants 1261 (53.3%) had normal OGTT, 317 (51.6%) of whom were men and 944 (53.8%) women. Diabetes was evident in 243 (10.3%) of participants, 78 (12.7%) men and 165 (9.4%) women. IGT occurred in 458 (19.3%), 86 (14.0%) men and 372 (21.2%) women. IFG was observed in 406 (17.1%), 132 (21.5%) men and 274 (15.6%) women. Nearly half of the participants (46.7%) were diabetic or had impaired glucose regulation.
First, univariate analysis was performed to determine the influence of gender and anthropometric measurements on diabetes, IGT, and IFG, (Table 2). Age-adjusted OR showed that IGT was more common among women (OR 0.66; 95% CI 0.51, 0.87), whereas diabetes (OR 1.31; 95% CI 0.96, 1.78) and IFG (OR 1.41; 95% CI 1.10, 1.80) was more common among men. Those who had diabetes and IGT were more likely to be older and have higher BMI. Also, women with diabetes and IGT were more likely to have higher WC and WHR.
Table
2.
Prevalence rates (%) of diabetes mellitus, impaired glucose tolerance and impaired fasting glucose in first-degree relatives of patients with type 2 diabetes by selected characteristics |
|
 |
|
Legend:
Data are number of cases (with percentage in parentheses) and age-adjusted odds ratio (with 95% CI in parentheses). Odds ratios calculated by binary logistic regression analysis. Cut-points for quartiles were 165.2, 169.7 and 173.9 cm for men, and 152.5, 155.8 and 159.5 cm for women. IGT: impaired glucose tolerance. IFG: impaired fasting glucose. BMI: body mass index. WHR: waist-to-hip ratio. OR: odds ratio. CI: confidence interval. * p < 0.5, ** p < 0.01, *** p < 0.001. |
|
The prevalence of diabetes was 16.6% (95% CI 10.6, 22.5) for men in the shortest quartile of height, and 12.3% (95% CI 7.1, 17.5) for the tallest quartile. The equivalent percentages for women were 10.7% (95% CI 7.8, 13.5) and 8.5% (95% CI 6.0, 11.6). For men in the shortest quartile of height, the prevalence of IGT was 15.9% (95% CI 10.1, 21.7) and 9.7% (95% CI 5.6, 15.6) for the tallest quartile. The equivalent percentages for women were 25.2 (95% CI 21.1, 29.2) and 17.9% (95% CI 14.3, 21.6). Whereas, the prevalence of IFG was 22.5% (95% CI 15.9, 29.2) for men in the shortest quartile of height, and 19.5% (95% CI 13.2, 25.7) for the tallest quartile. The equivalent percentages for women were 13.2% (95% CI 10.0, 16.3) and 17.2% (95% CI 13.6, 20.8). These differences in the prevalence of diabetes, IGT, and IFG were not statistically significant.
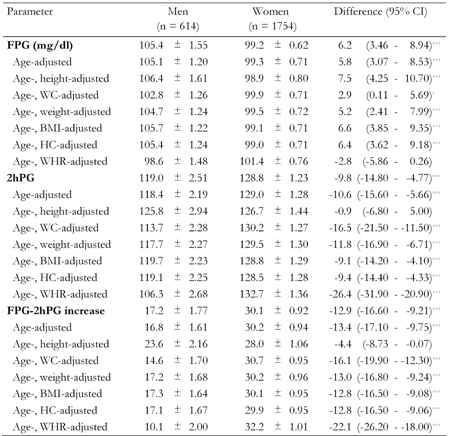
Table 3 shows glucose parameters mean differences between men and women, when adjusted for age and anthropometric measurements. Women had lower FPG levels despite all adjustment comparators except for WHR. After adjustment for WHR the lower FPG exhibited in women was reversed, and was no longer significant. Whereas after adjustment, men had lower mean 2hPG levels, and FPG-2hPG increase. The 2hPG and FPG-2hPG increase seen in men, became insignificant after adjustment for age and height.
Table
3.
Age- and anthropometric-adjusted glucose parameters among first-degree relatives of type 2 diabetes patients |
|
 |
|
Legend:
Data are age- and anthropometric-adjusted means ± standard error of glucose parameters among 614 men and 1754 women. Age-adjusted means were calculated using general linear model. FPG: fasting plasma glucose. WC: waist circumference. BMI: body mass index. HC: hip circumference. WHR: waist-to-hip ratio. FG: fasting glucose. PG: plasma glucose. * p < 0.05. ** p < 0.01, *** p < 0.001. |
|
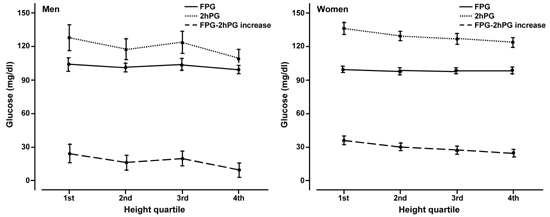
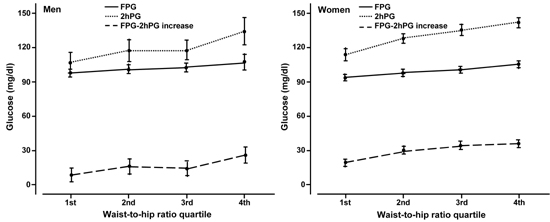
Figure 1 shows that with increasing height, the 2hPG and FPG-2hPG increase, fell markedly (p < 0.001) in both men and women, whilst there was very little change in FPG. Figure 2 shows that with increasing WHR, the FPG, 2hPG, and FPG-2hPG increase, rose markedly both in men and women. Similar relationships were found when the analysis was repeated for BMI and WC (data not shown).
 |
|
Figure 1. Age-adjusted mean fasting plasma glucose (FPG), 2-h plasma glucose (2hPG) and FPG-2hPG increase by height quartile and gender. Error bars are for 95% confidence intervals. |
|
 |
|
Figure 2. Age-adjusted mean fasting plasma glucose (FPG), 2-h plasma glucose (2hPG) and FPG-2hPG increase by waist-to-hip ratio quartile and gender. Error bars are for 95% confidence intervals. |
|
Both for men and women, height was inversely correlated with 2hPG (r = -0.76, p < 0.001, men; r = -0.69, p < 0.001, women) and FPG-2hPG increase (r = -0.39, p < 0.001; men; r = -0.27, p < 0.001, women).
Discussion
Consistent with previous studies [1, 5, 14, 24], the present one involving non-diabetic FDR of patients with type 2 diabetes found a similarly higher prevalence of IFG in men, and higher prevalence of IGT in women. Also, it was seen that women had a lower mean FPG, higher 2hPG, and greater FPG-2hPG increase. The reason for this gender difference in glucose metabolism has not been fully explored until now [6, 10]. Some studies [7, 8, 13], but not all [25], suggest that short height may contribute to gestational diabetes. The association between height and 2hPG in adults without gestational diabetes has also been reported for diverse populations [6, 10, 11, 26-28], but the results were inconsistent. Some showed an inverse association [6, 10, 26, 27], whereas other studies showed no significant association between height and response to OGTT [28]. Recently, Sicree et al. in the Australian Diabetes, Obesity and Lifestyle (AusDiab) study found an inverse association between height and response to OGTT as an explanation of gender differences in the prevalence of glucose intolerance [14]. Our findings confirm this association in the subject population of FDR of people with type 2 diabetes. Similarly, we found that height was inversely associated with 2hPG and FPG-2hPG increase among both men and women, and there was no association with the mean FPG.
Obesity was a predictor of FPG in both genders. When we dichotomized response to OGTT as in ADA defined glucose metabolism, the inverse association of height quartiles and diabetes, IGT, and IFG remained but was not statistically significant. This was due to lack of statistical power to adequately analyze the association. However, when FPG, 2-hPG or FPG-2hPG increase were treated as continuous variables the association became more clear and significant.
The mechanisms whereby height is inversely associated with 2hPG in men and women are not clear. Sicree et al. suggested that height may be influencing 2hPG but not FPG because "taller individuals (mostly men) have more muscle mass. Muscle is the major tissue involved in uptake/metabolism of glucose, against the fixed glucose load of 75 g" [14]. Another possible explanation for these findings suggested by Sicree et al. is that the dilution effect of total body water may also contribute [14]. Therefore, larger metabolic studies are warranted to assess the contribution made by these factors.
Other studies suggested that the observed gender differences in the glucose metabolism may be mediated by female sex hormones [29]. Estrogen may be influencing fasting glucose levels by impacting insulin sensitivity. However, as there was no measure of sex hormones in IDPS, we cannot evaluate whether the gender differences in the glucose metabolism was mediated by reduced female sex hormones, or due to height differences between men and women, or both.
The role of genetic factors in the height/glucose metabolism relationship has not yet been studied even in twins, which are often advocated for testing a genetic influence. In accordance with the AusDiab findings, our results would be compatible with the hypothesis of higher 2hPG in women was a result of their smaller body size in relation to the fixed glucose load of the OGTT.
It is noteworthy, that in the present analysis, an association of FPG, 2hPG and FPG-2hPG increase with obesity was found both in men and women. Obesity is associated with glucose intolerance in the general population. However, our findings confirm this association in this population of FDR of people with type 2 diabetes. These observations have important implications for the pathogenesis of abnormal glucose metabolism. We have explored further the gender differences, as they may have important implications both for the understanding of the pathogenesis of abnormal glucose metabolism and for the methods of screening men and women for this condition. The implications for screening abnormal glucose metabolism are highly pertinent.
Our study has strengths and limitations. The strengths include the sample consisting of both men and women of a wide age range, diagnosis of diabetes based on standard OGTT, and information on potential determinants of glucose intolerance. Selection and information bias is considered unlikely by virtue of the prospective design. Our study was addressed to individuals at increased risk of developing type 2 diabetes, because they had FDR with the disease. This group of individuals will increase with time as the prevalence of diabetes is expected to increase worldwide [30]. In our cohort, which was recruited between 2003 and 2005, we found a very high prevalence of previously undiagnosed diabetes (10.3%) and IGT (19.3%). The proportions were significantly higher than those reported for the general Iranian population (type 2 diabetes, 6.0% and IGT 9.6 [31]). However, in this at-risk group, we observed that the gender differences in IFG and IGT were similar to those previously reported for other groups [1-5]. Thus, we believe our findings are also applicable to the general population when considering the role of height on glucose tolerance.
In conclusion, these data provides further evidence that the women had higher 2hPG and FPG-2hPG increase, and a lower FPG level than men. The higher 2hPG and FPG-2hPG increase, associated with lesser height may be explained by these gender differences. These findings may prove useful to assess OGTT across populations and may represent a more severe metabolic disturbance in a tall person than a shorter one. Adjusting the results according to body size may improve OGTT. Further studies are needed to better understand the role of height on gender differences in glucose metabolism.
Acknowledgments:
We are grateful to Mr. Majid Abyar for computer technical assistance. This study could not have been conducted without the contribution of the FDR of patients with type 2 diabetes who consented to participate.
References
- Williams JW, Zimmet PZ, Shaw JE, de Courten MP, Cameron AJ, Chitson P, Tuomilehto J, Alberti KG. Gender differences in the prevalence of impaired fasting glycaemia and impaired glucose tolerance in Mauritius. Does sex matter? Diabet Med 2003. 20:915-920. [DOD] [CrossRef]
- Glumer C, Jorgensen T, Borch-Johnsen K. Inter99 study. Prevalence of diabetes and impaired glucose regulation in a Danish population: the Inter99 study. Diabetes Care 2003. 26:2335-2340. [DOD] [CrossRef]
- Amini M, Janghorbani M. Diabetes and impaired glucose regulation in first-degree relatives of patients with type 2 diabetes in Isfahan, Iran: prevalence and risk factors. Rev Diabet Stud 2007. 4:169-176. [DOD] [CrossRef]
- Dunstan DW, Zimmet PZ, Welborn TA, De Courten MP, Cameron AJ, Sicree RA, Dwyer T, Colagiuri S, Jolley D, Knuiman M, et al. The rising prevalence of diabetes and impaired glucose tolerance: the Australian Diabetes, Obesity and Lifestyle Study. Diabetes Care 2002. 25:829-834. [DOD] [CrossRef]
- Unwin N, Shaw J, Zimmet P, Alberti KG. Impaired glucose tolerance and impaired fasting glycaemia: the current status on definition and intervention. Diabet Med 2002. 19:708-723. [DOD] [CrossRef]
- Brown DC, Byrne CD, Clark PM, Cox BD, Day NE, Hales CN, Shackleton JR, Wang TW, Williams DR. Height and glucose tolerance in adult subjects. Diabetologia 1991. 34(7):531-533. [DOD] [CrossRef]
- Anastasiou E, Alevizaki M, Grigorakis SJ, Philippou G, Kyprianou M, Souvatzoglou A. Decreased stature in gestational diabetes mellitus. Diabetologia 1998. 41:997-1001. [DOD] [CrossRef]
- Jang HC, Min HK, Lee HK, Cho NH, Metzger BE. Short stature in Korean women: a contribution to the multifactorial predisposition to gestational diabetes mellitus. Diabetologia 1998. 41:778-783. [DOD] [CrossRef]
- Mooy JM, Grootenhuis PA, de Vries H, Valkenburg HA, Bouter LM, Kostense PJ, Heine RJ. Prevalence and determinants of glucose intolerance in a Dutch Caucasian population. The Hoorn Study. Diabetes Care 1995. 18(9):1270-1273. [DOD] [CrossRef]
- Quatraro A, Minei A, De Rosa N, Giugliano D. Height and glucose tolerance. Diabetologia 1992. 35:698-699. [DOD] [CrossRef]
- Olatunbosun ST, Bella AF. Relationship between height, glucose intolerance, and hypertension in an urban African black adult population: a case for the "thrifty phenotype" hypothesis? J Natl Med Assoc 2000. 92:265-268. [DOD]
- Lawlor DA, Ebrahim S, Davey Smith G. The association between components of adult height and Type II diabetes and insulin resistance: British Women's Heart and Health Study. Diabetologia 2002. 45:1097-1106. [DOD] [CrossRef]
- Kousta E, Lawrence NJ, Penny A, Millauer BA, Robinson S, Johnston DG, McCarthy MI. Women with a history of gestational diabetes of European and South Asian origin are shorter than women with normal glucose tolerance in pregnancy. Diabet Med 2000. 17(11):792-797. [DOD] [CrossRef]
- Sicree RA, Zimmet PZ, Dunstan DW, Cameron AJ, Welborn TA, Shaw JE. Differences in height explain gender differences in the response to the oral glucose tolerance test - the AusDiab study. Diabet Med 2008. 25(3):296-302. [DOD] [CrossRef]
- Silventoinen K, Kaprio J, Lahelma E, Koskenvuo M. Relative effect of genetic and environmental factors on body height: differences across birth cohorts among Finnish men and women. Am J Public Health 2000. 90:627-630. [DOD] [CrossRef]
- Hirschhorn JN, Lindgren CM, Daly MJ, Kirby A, Schaffner SF, Burtt NP, Altshuler D, Parker A, Rioux JD, Platko J, et al. Genomewide linkage analysis of stature in multiple populations reveals several regions with evidence of linkage to adult height. Am J Hum Genet 2001. 69(1):106-116. [DOD] [CrossRef]
- Grill V, Persson G, Carlsson S, Norman A, Alvarsson M, Ostensson CG, Svanström L, Efendic S. Family history of diabetes in middle-aged Swedish men is a gender unrelated factor which associates with insulinopenia in newly diagnosed diabetic subjects. Diabetologia 1999. 42(1):15-23. [DOD] [CrossRef]
- Park HS, Yim KS, Cho SI. Gender differences in familial aggregation of obesity-related phenotypes and dietary intake pattern in Korean families. Ann Epidemiol 2004. 14:486-491. [DOD] [CrossRef]
- Li JK, Ng MC, So WY, Chiu CK, Ozaki R, Tong PC, Cockram CS, Chan JC. Phenotypic and genetic clustering of diabetes and metabolic syndrome in Chinese families with type 2 diabetes mellitus. Diabetes Metab Res Rev 2006. 22(1):46-52. [DOD] [CrossRef]
- Ramachandran A, Snehalatha C, Satyavani K, Sivasankari S, Vijay V. Cosegregation of obesity with familial aggregation of type 2 diabetes mellitus. Diabetes Obes Metab 2000. 2:149-154. [DOD] [CrossRef]
- Borkan GA, Hultus DE. Relationships between computed tomography tissue areas, thickness and total body composition. Ann Hum Biol 1983. 10:537-546. [DOD] [CrossRef]
- Ross R, Shaw KD, Rissanen J, Martel Y, de Guise J, Avruch L. Sex differences in lean and adipose tissue distribution by magnetic resonance imaging: anthropometric relationship. Am J Clin Nutr 1994. 58:277-285. [DOD]
- Expert Committee on the Diagnosis and Classification of Diabetes Mellitus. Report of the expert committee on the diagnosis and classification of diabetes mellitus. Diabetes Care 2003. 26(Suppl 1):S5-S20. [DOD]
- Genuth S, Alberti KG, Bennett P, Buse J, Defronzo R, Kahn R, Kitzmiller J, Knowler WC, Lebovitz H, et al. Follow-up report on the diagnosis of diabetes mellitus. Diabetes Care 2003. 26(11):3160-3167. [DOD] [CrossRef]
- Tabak AG, Kerenyi Z, Nagy E, Bosnyak Z, Madarasz E, Tamas G. Height and gestational diabetes mellitus. Diabet Med 2000. 17:792-797. [DOD] [CrossRef]
- Pan WH, Yeh WT, Hwu CM, Ho LT. Undiagnosed diabetes mellitus in Taiwanese subjects with impaired fasting glycemia: impact of female sex, central obesity, and short stature. Chin J Physiol 2001. 44:44-51. [DOD]
- Williams DR, Wareham NJ, Brown DC, Byrne CD, Clark PM, Cox BD, Cox LJ, Day NE, Hales CN, Palmer CR, et al. Undiagnosed glucose intolerance in the community: the Isle of Ely Diabetes Project. Diabet Med 1995. 12(1):30-35. [DOD]
- McKeigue PM, Shah B, Marmot MG. Relation of central obesity and insulin resistance with high diabetes prevalence and cardiovascular risk in South Asians. Lancet 1991. 337:382-386. [DOD] [CrossRef]
- van Genugten RE, Utzschneider KM, Tong J, Gerchman F, Zraika S, Udayasankar J, Boyko EJ, Fujimoto WY, Kahn SE, American Diabetes Association GENNID Study Group. Effects of sex and hormone replacement therapy use on the prevalence of isolated impaired fasting glucose and isolated impaired glucose tolerance in subjects with a family history of type 2 diabetes. Diabetes 2006. 55(12):3529-3535. [DOD] [CrossRef]
- Wild S, Roglic G, Green A, Sicree R, King H. Global prevalence of diabetes: estimates for the year 2000 and projections for 2030. Diabetes Care 2004. 27:1047-1053. [DOD] [CrossRef]
- International Diabetes Federation. Diabetes Atlas. 3rd edition, 2006. [DOD]
This article has been cited by other articles:
|


)
)
)
)
)